 Stakeholder Onion Diagrams
The Stakeholder Onion Diagram is often used as a way to view the relationships of stakeholders to a project goal. A basic Onion Diagram contains a rich information. It shows significance of stakeholders that will have has influence to the success achieve
Onion Diagram Process Design

HR Management Software

Pyramid Diagram

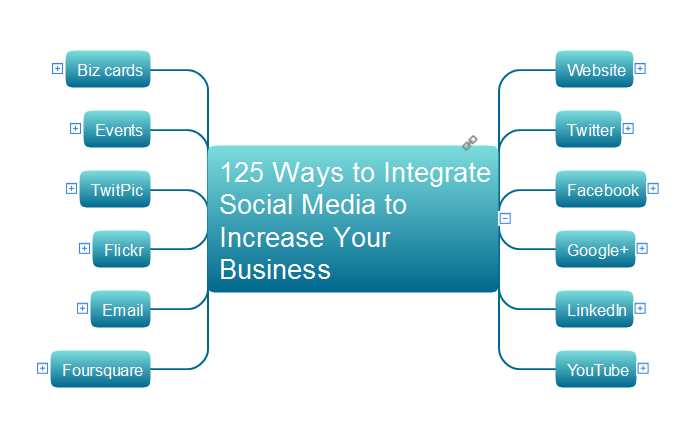
125 Ways to Integrate Social Media to Increase Your Business
PDPC

 Business Diagrams Package
Business Diagrams Package is a large set of comprehensive graphical solutions from the ConceptDraw Solution Park, which are powerful in solving the business, marketing and quality tasks in completely different fields, such as finance, education, health food and cooking, HR, and many others. The tools of this package's solutions are a powerful assistant in drawing all diversity of Financial and Marketing infographics, Business process workflow diagrams, Organizational charts, Education infographics, Quality diagrams, Health food diagrams, HR flowcharts, as well as different graphics and charts, which depict the values of key business indicators, their dependencies, give the full understanding of a situation within a company and on the market.
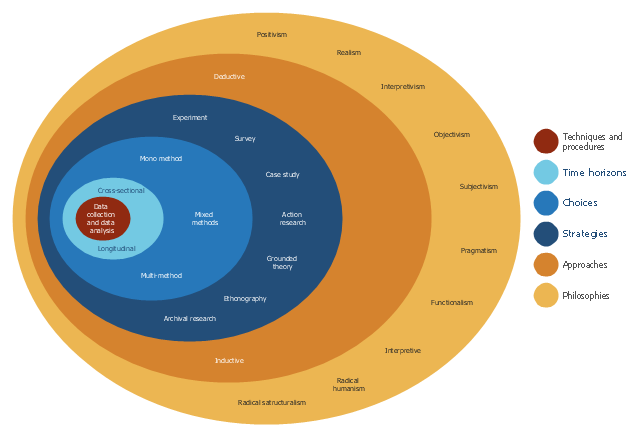
This onion diagram example was designed on the base of figure "Research onion" in the article "The research methodology for the development of a kaizen costing framework suitable for indigenous construction firms in Lagos, Nigeria." by T. Omotayo and U. Kulatunga from the Association of Researchers in Construction Management (ARCOM) website.
"The need for a cost management paradigm shift in the construction industry is imperative because of the prevailing challenges of managing construction cost during construction. Small and medium scale construction firms in Nigeria are faced with the challenges of competition from foreign firm, cost overrun, project delays and unsatisfied clients. This challenge may be handled with kaizen principles and kaizen costing. This paper utilized literatures related to research methodology in the built environment to create a research framework for the study. This focused on the research philosophical stands, approaches and strategy related to the built environment. The research onion model was adopted for the framework development and the sample size of two hundred and fifty (250) respondents was selected based on theoretical sampling for quantitative data collection using questionnaires." [arcom.ac.uk/ -docs/ workshops/ 2015-04_ Dublin-Proceedings.pdf]
The onion diagram example "Research onion diagram" was drawn using the ConceptDraw PRO software extended with the Stakeholder Onion Diagrams solution from the Management area of ConceptDraw Solution Park.
Onion diagram example
- Stakeholder Onion Diagrams | Image Of Secondary Sector As ...
- Primary Sector Secondary Sector And Tertiary Sector Flow Diagram
- The Flow Chart Of Primary Sector And Secondary Sector And Tertiary
- Sector diagram - Template | Stakeholder Onion Diagrams | How To ...
- Stakeholder Onion Diagrams | Draw A Flow Chart To Show The ...
- Economic sector weightings | Stakeholder Onion Diagrams ...
- Economic sector weightings | How To use House Electrical Plan ...
- Stakeholder Onion Diagrams | Graph Representation Of Primary ...
- Sector diagram - Template | Onion diagram with 3 sectors ...
- Stakeholder Onion Diagrams | Draw Or Design A Picture That ...