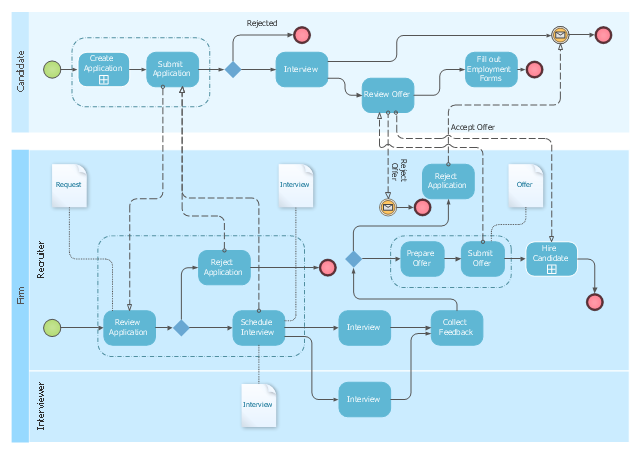
This BPMN diagram sample shows the recruitment (hiring) process workflow.
"Recruitment refers to the process of attracting, screening, selecting, and onboarding a qualified person for a job. At the strategic level it may involve the development of an employer brand which includes an "employee offering".
The stages of the recruitment process include: job analysis and developing some person specification; the sourcing of candidates by networking, advertising, and other search methods; matching candidates to job requirements and screening individuals using testing (skills or personality assessment); assessment of candidates' motivations and their fit with organizational requirements by interviewing and other assessment techniques. The recruitment process also includes the making and finalizing of job offers and the induction and onboarding of new employees.
Depending on the size and culture of the organization, recruitment may be undertaken in-house by managers, human resource generalists and/ or recruitment specialists. Alternatively, parts of the process may be undertaken by either public-sector employment agencies, commercial recruitment agencies, or specialist search consultancies." [Recruitment. Wikipedia]
The BPMN (Business Process Model and Notation) diagram example "Hiring process BPMN 1.2 diagram" was created using the ConceptDraw PRO diagramming and vector drawing software extended with the Business Process Diagram solution from the Business Processes area of ConceptDraw Solution Park.
Employee recruitment workflow
Entity Relationship Diagram Examples


Organizational Charts with ConceptDraw DIAGRAM

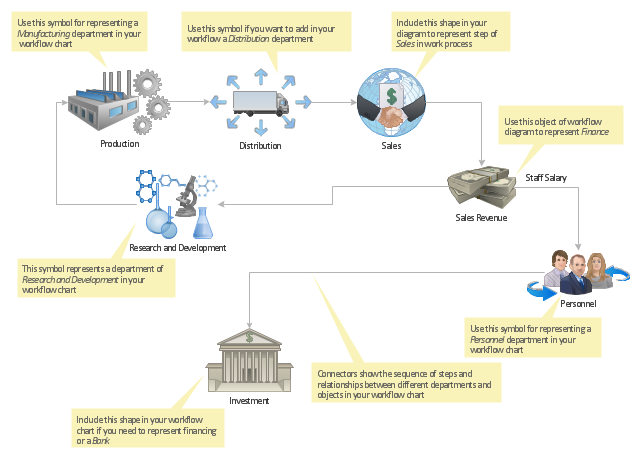
"Workflow components.
A workflow can usually be described using formal or informal flow diagramming techniques, showing directed flows between processing steps. Single processing steps or components of a workflow can basically be defined by three parameters:
(1) input description: the information, material and energy required to complete the step,
(2) transformation rules, algorithms, which may be carried out by associated human roles or machines, or a combination,
(3) output description: the information, material and energy produced by the step and provided as input to downstream steps.
Components can only be plugged together if the output of one previous (set of) component(s) is equal to the mandatory input requirements of the following component. Thus, the essential description of a component actually comprises only in- and output that are described fully in terms of data types and their meaning (semantics). The algorithms' or rules' description need only be included when there are several alternative ways to transform one type of input into one type of output – possibly with different accuracy, speed, etc.
When the components are non-local services that are invoked remotely via a computer network, such as Web services, additional descriptors (such as QoS and availability) also must be considered." [Workflow. Wikipedia]
The workflow diagram template for the ConceptDraw PRO diagramming and vector drawing software is included in the Workflow Diagrams solution from the Business Processes area of ConceptDraw Solution Park.
Workflow diagram template
ConceptDraw Arrows10 Technology
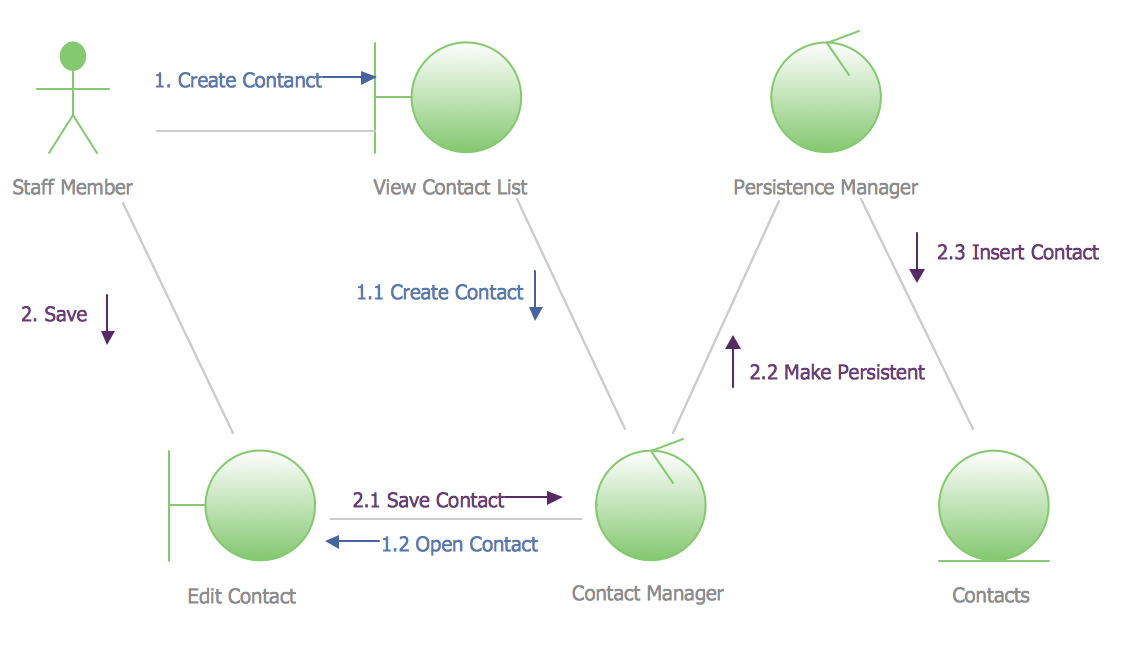
UML Collaboration Diagram Example Illustration
How to Draw an Organization Chart

Organogram Software

Flow chart Example. Warehouse Flowchart


Network diagrams with ConceptDraw DIAGRAM

- Draw An ER Diagram Of A Staff Management System Of An
- Sports bar - Floor plan | Office Layout Plans | Bubble Diagrams ...
- Restaurant Staff Diagram
- A Data Flow Diagram Showing The Stages Of Staff Development ...
- Diagram Of Manufacturing Staff
- Medical Store Management System Er Diagram Meaning Of Staff
- Activity Diagram For Employee Tracking System
- Diagram Of The Process Of Hiring Staff In An Organization
- Data Flow Diagram Of Mall Staff Management System
- Interior Layout Drawing Plan Of School Staff Room