Porter's Value Chain

Best Value Stream Mapping mac Software

Deployment Chart Software

 Logistics Flow Charts
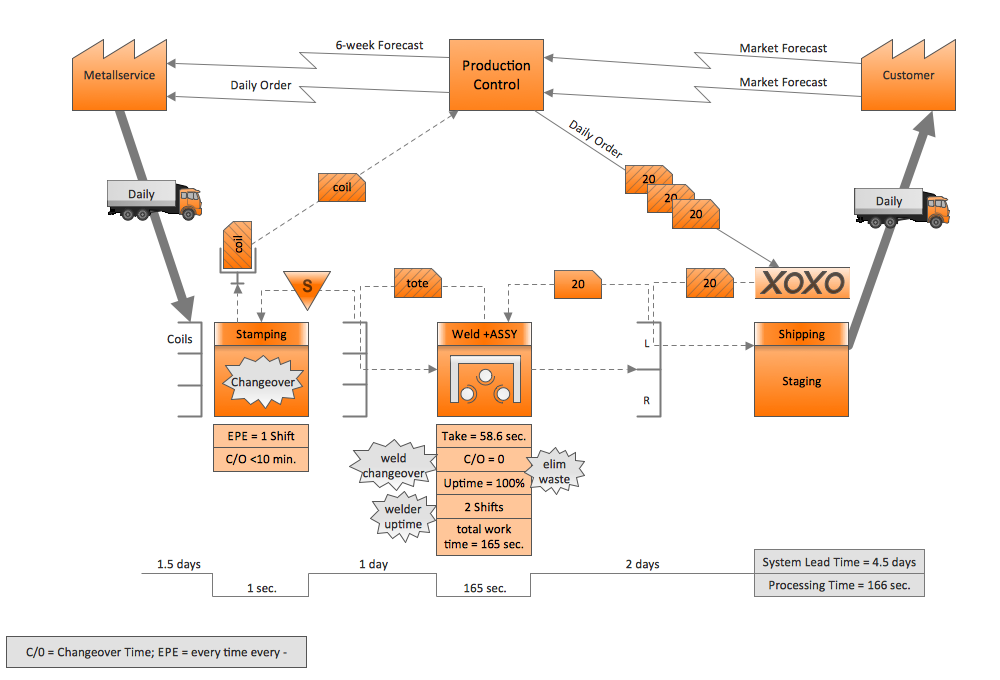
Logistics Flow Charts solution extends ConceptDraw DIAGRAM functionality with opportunities of powerful logistics management software. It provides large collection of predesigned vector logistic symbols, pictograms, objects and clipart to help you design with pleasure Logistics flow chart, Logistics process flow diagram, Inventory flow chart, Warehouse flowchart, Warehouse management flow chart, Inventory control flowchart, or any other Logistics diagram. Use this solution for logistics planning, to reflect logistics activities and processes of an enterprise or firm, to depict the company's supply chains, to demonstrate the ways of enhancing the economic stability on the market, to realize logistics reforms and effective products' promotion.
EPC - Business Processes in Terms of Work Flows

VSM
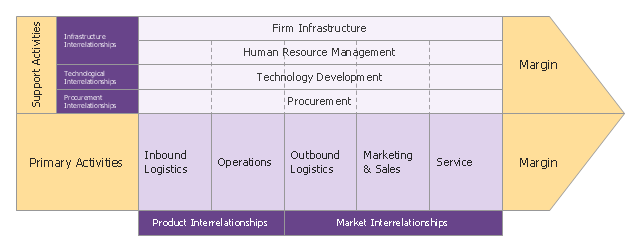
"A value chain is a chain of activities that a firm operating in a specific industry performs in order to deliver a valuable product or service for the market. ...
The concept of value chains as decision support tools, was added onto the competitive strategies paradigm developed by Porter as early as 1979. In Porter's value chains, Inbound Logistics, Operations, Outbound Logistics, Marketing and Sales and Service are categorized as primary activities. Secondary activities include Procurement, Human Resource management, Technological Development and Infrastructure." [Value chain. Wikipedia]
This Porter's value chain matrix diagram example was created using the ConceptDraw PRO diagramming and vector drawing software extended with the Matrices solution from the Marketing area of ConceptDraw Solution Park.
Porter's value chain matrix

SWOT analysis Software & Template for Macintosh and Windows

How to Discover Critical Path on a Gantt Chart

- Porter's value chain diagram
- Porter's Value Chain | SWOT Analysis Software | Deployment Chart ...
- Porter's Value Chain | Process Flowchart | SWOT Analysis matrix ...
- Porter's Value Chain | Competitor Analysis | Matrices | Bcg Matrix ...
- Porter's value chain diagram - Template
- Competitor Analysis | Porter's Value Chain | Business Productivity ...
- Value Chain Analysis Example
- Porter's value chain matrix diagram | Value Stream Mapping ...
- Value Chain Software Development Company
- Porter's Value Chain | Software for Creating SWOT Analysis ...