This site uses cookies. By continuing to browse the ConceptDraw site you are agreeing to our Use of Site Cookies.

Project Timeline

Project timeline is a type of chart which allows visually represent the chronology of works for the project, placing the key points of the project (milestones) on a timescale. You need to make professional looking project timeline? Create it with ConceptDraw DIAGRAM ! ConceptDraw DIAGRAM extended with Timeline Diagrams Solution from the Management Area is the best timeline diagrams software

Gantt charts for planning and scheduling projects

ConceptDraw PROJECT is an excellent simple project scheduling software. It maintain classic project gantt charts and the line of professional reports on resources usage. It include handy critical path scheduling software tools and diagraming tools which helps prepare the presentation of project status. It include project tracking dashboard to keep project metrics upto date, also it have handy feature to export project management dashboard in excel file.

Software development with ConceptDraw products

Internet solutions on ConceptDraw base. What may interest developers of Internet solutions.

UML Class Diagram Example - Apartment Plan

UML Apartment Plan. This sample was created in ConceptDraw DIAGRAM diagramming and vector drawing software using the UML Class Diagram library of the Rapid UML Solution from the Software Development area of ConceptDraw Solution Park. This sample show the detailed plan of the apartment and is used by building companies, design apartments, real estate agencies, at the buying / selling of the realty.

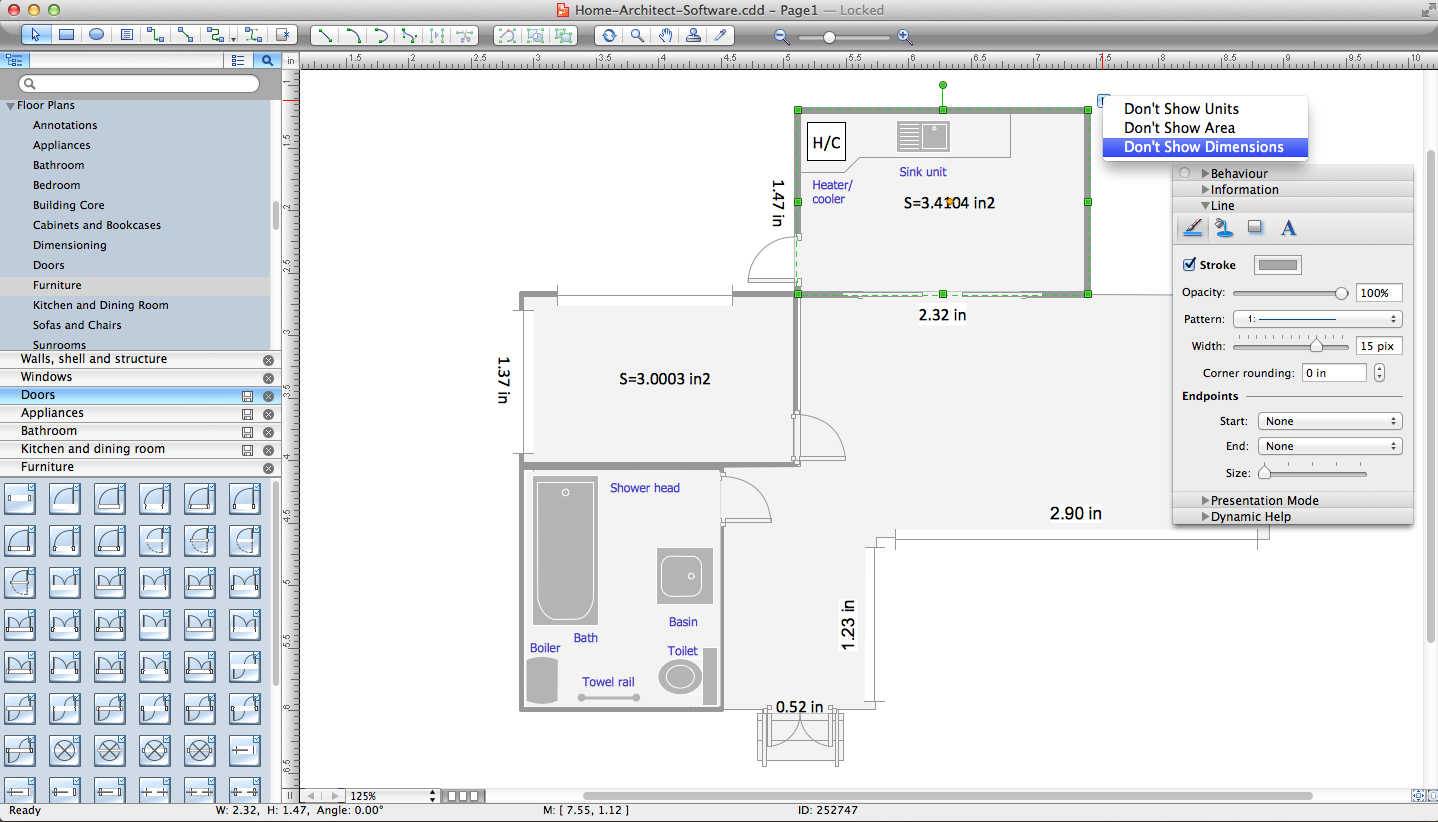
Home Architect Software. Home Plan Examples

Everyone who starts the construction, repair or remodeling of the home, flat or office, is facing with a need of visualization its ideas for visual explanation how all should to be for the foreman and construction team. It is incredibly convenient to use for this professional home architect software. ConceptDraw DIAGRAM software enhanced with Floor Plans solution provides a lot of built-in drawing tools which allow you quick and easy create design plans for the home of your dreams.

Program Evaluation and Review Technique (PERT) with ConceptDraw DIAGRAM

Program Evaluation and Review Technique (abbr. PERT) is a method developed by Ministry of Defense of the USA in 1958 for the project of creation the missile system Polaris. PERT diagram is one of the tools for project management that lets greatly simplify the planning and scheduling of large and complex projects. PERT diagram provides evaluation of project run-time and labor forces, it helps to analyze the time necessary for execution each of project tasks and the whole project, and to calculate the project critical path. PERT chart depicts the set of tasks connected each other in order of their execution and is constructed according to one of definite rules - AOA (activity on arrow) or AON (activity on node). It doesn't give you ready concrete decisions, but helps to find them. Design easy the PERT diagrams in ConceptDraw DIAGRAM software enhanced with Seven Management and Planning Tools solution from Management area of ConceptDraw Solution Park. You have a possibility to build the PERT chart of any type, but AON variant is easier for building and perception.

timeline diagram, timeline template Timeline Diagrams

timeline diagram, timeline template
Timeline Diagrams solution extends ConceptDraw DIAGRAM diagramming software with samples, templates and libraries of specially developed smart vector design elements of timeline bars, time intervals, milestones, events, today marker, legend, and many other elements with custom properties, helpful for professional drawing clear and intuitive Timeline Diagrams. Use it to design simple Timeline Diagrams and designate only the main project stages, or highly detailed Timeline Diagrams depicting all project tasks, subtasks, milestones, deadlines, responsible persons and other description information, ideal for applying in presentations, reports, education materials, and other documentation.

Gant Chart in Project Management

Gantt Chart is a graphical representation of tasks as segments on a time scale. It helps plan and monitor project development or resource allocation. There are list of tasks, project milesones and stages. The horizontal axis is a time scale, expressed either in absolute or relative time. Gantt chart can be used for planning in virtually any industry. There are major project planning tools using gantt chart for creating project plan. For instance, using ConceptDraw PROJECT together with ConceptDraw MINDMAP for planning marketing actions is very effective way. It makes ConceptDraw Office best marketing project management software for gantt chart planning marketing message, scheduling stages when to send massive text messages or when use email marketing services in specific projects. There are simple steps on how to use project management software for marketing, sales actions and product support. This is simple all in one toolbox for managers who need best project management software for small business as for planning and brainstorming as for reporting at project execution stage. Using gantt charts together with mindmap visuals and professional presentations charts make it excellent creative project management software. ConceptDraw PROJECT is portfolio project management software it allows manage many projects with multi gantt chart.
what is software project management

Timeline Examples

ConceptDraw DIAGRAM diagramming and vector drawing software offers the Timeline Diagrams solution from the Management area which is rich for the timeline examples, samples, templates and ready-to-use vector shapes.