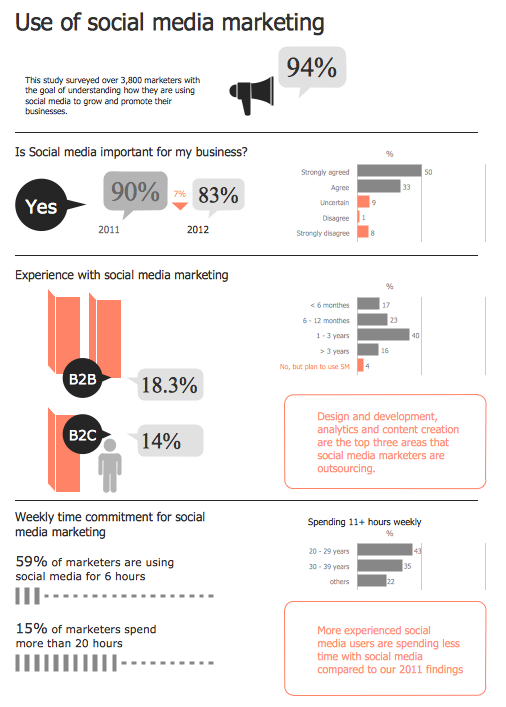
Social Media Marketing Infographic
Best Diagramming


SWOT Analysis

Social Media Flowchart Symbols

The vector stencils library "Sales KPIs and Metrics" contains 15 chart templates and graphic indicators of sales key performance indicators (KPIs) and metrics.
Use it for drawing sales dashboards in the ConceptDraw PRO diagramming and vector drawing software extended with the Sales Dashboard solution from the Marketing area of ConceptDraw Solution Park.
Use it for drawing sales dashboards in the ConceptDraw PRO diagramming and vector drawing software extended with the Sales Dashboard solution from the Marketing area of ConceptDraw Solution Park.
Actual vs Plan

Average Purchase Value

Clicks from Sales Follow-Up Emails

Cost per customer

Cost per order

Lead Response Time

Opportunity-to-Win Ratio

Product mix

Product Performance

Rate of Contact

Rate of Follow Up Contact

Sales Growth

Sales Target

Social Media Usage

Usage Rate of Marketing Collateral

Mind Maps for Business - SWOT Analysis

Business Productivity - Management

The vector stencils library "Sales KPIs and Metrics" contains 15 chart templates and graphic indicators of sales key performance indicators (KPIs) and metrics.
Use it for drawing sales dashboards in the ConceptDraw PRO diagramming and vector drawing software extended with the Sales Dashboard solution from the Marketing area of ConceptDraw Solution Park.
Use it for drawing sales dashboards in the ConceptDraw PRO diagramming and vector drawing software extended with the Sales Dashboard solution from the Marketing area of ConceptDraw Solution Park.
Actual vs Plan
Average Purchase Value
Clicks from Sales Follow-Up Emails
Cost per customer
Cost per order
Lead Response Time
Opportunity-to-Win Ratio
Product mix
Product Performance
Rate of Contact
Rate of Follow Up Contact
Sales Growth
Sales Target
Social Media Usage
Usage Rate of Marketing Collateral
How to Prepare Learning Presentations for Training
- Social Media Marketing Infographics
- Social Relationship Marketing Pyramid
- Marketing - Vector stencils library | Sales KPIs and Metrics - Vector ...
- Benefit Of Internet To Marketing Diagram
- Marketing - Design Elements | Marketing - Vector stencils library ...
- How to Create Marketing Infographics | Marketing Infographics | Use ...
- Marketing mix - Wheel diagram | Target market | Use of social media ...
- Design elements - Advertising | Advertising - Vector stencils library ...
- Internet marketing - Concept map | Target market | How to Draw a ...
- Social Media Marketing Infographic