 Security and Access Plans
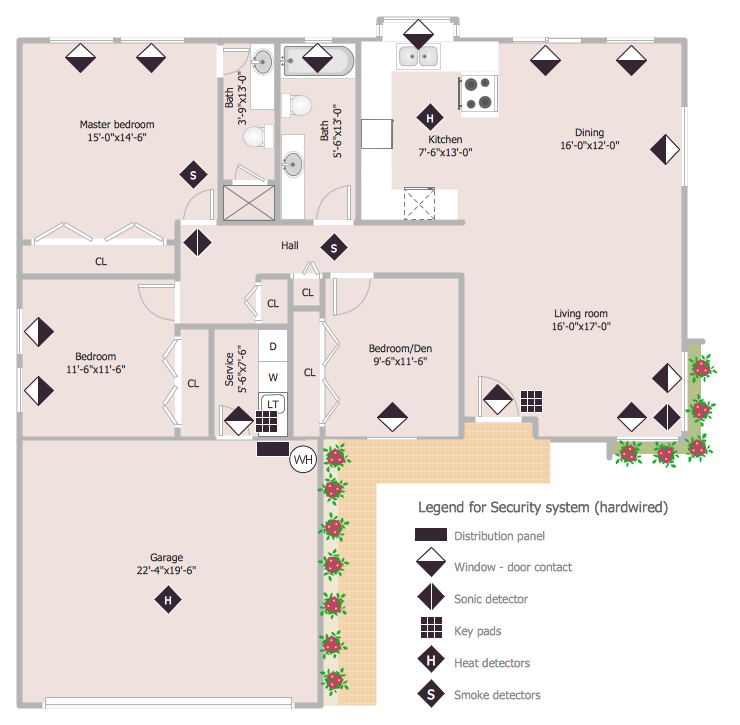
The Security and Access Plans solution may be utilized in order to develop detailed equipment and cabling layout plans, blueprints, and wiring diagrams on internal and external security and access control systems, video surveillance and closed-circuit television (CCTV) systems. IT specialists, security managers, and other guards may use it to quickly design security plans and access plans, security chart, physical security plan, access chart, or access scheme on desire.
This flow chart sample was drawn on the base on the illustration of the article "Climate change impact on China food security in 2050" from the website of Chinese Academy of Agricultural Sciences .
[caas.cn/ en/ newsroom/ research_ update/ 67347.shtml]
"Food security is a condition related to the ongoing availability of food. ...
According to the Food and Agriculture Organization (FAO), food security "exists when all people, at all times, have physical and economic access to sufficient, safe and nutritious food to meet their dietary needs and food preferences for an active and healthy life". ...
Extreme events, such as droughts and floods, are forecast to increase as climate change takes hold. Ranging from overnight floods to gradually worsening droughts, these will have a range of impacts on the agricultural sector. ...
According to the Climate & Development Knowledge Network report Managing Climate Extremes and Disasters in the Agriculture Sectors: Lessons from the IPCC SREX Report, the impacts will include changing productivity and livelihood patterns, economic losses, and impacts on infrastructure, markets and food security. Food security in future will be linked to our ability to adapt agricultural systems to extreme events." [Food security. Wikipedia]
The flowchart example "Food security assessment" was created using the ConceptDraw PRO diagramming and vector drawing software extended with the Flowcharts solution from the area "What is a Diagram" of ConceptDraw Solution Park.
Flowchart

 ConceptDraw Solution Park
ConceptDraw Solution Park collects graphic extensions, examples and learning materials
 Audit Flowcharts
Audit flowcharts solution extends ConceptDraw DIAGRAM software with templates, samples and library of vector stencils for drawing the audit and fiscal flow charts.
HelpDesk
How to Draw a Security and Access Floor Plan
 Safety and Security
Safety and security solution extends ConceptDraw DIAGRAM software with illustration samples, templates and vector stencils libraries with clip art of fire safety, access and security equipment.
 Network Security Diagrams
The Network Security Diagrams solution presents a large collection of predesigned cybersecurity vector stencils, cliparts, shapes, icons and connectors to help you succeed in designing professional and accurate Network Security Diagrams, Network Security Infographics to share knowledge about effective ways of networks protection with help of software and network security devices of different cyber security degrees, Network Plans for secure wireless network, Computer Security Diagrams to visually tell about amazing possibilities of IT security solutions. The samples and examples reflect the power of ConceptDraw DIAGRAM software in drawing Network Security Diagrams, give the representation about variety of existing types of attacks and threats, help to realize their seriousness and the methods to deal with them.
Business diagrams & Org Charts with ConceptDraw DIAGRAM


 Area Charts
Area Charts are used to display the cumulative totals over time using numbers or percentages; or to show trends over time among related attributes. The Area Chart is effective when comparing two or more quantities. Each series of data is typically represented with a different color, the use of color transparency in an object’s transparency shows overlapped areas and smaller areas hidden behind larger areas.
 Pie Charts
Pie Charts are extensively used in statistics and business for explaining data and work results, in mass media for comparison (i.e. to visualize the percentage for the parts of one total), and in many other fields. The Pie Charts solution for ConceptDraw DIAGRAM offers powerful drawing tools, varied templates, samples, and a library of vector stencils for simple construction and design of Pie Charts, Donut Chart, and Pie Graph Worksheets.
- Security and Access Plans | How to Draw a Security and Access ...
- Flow Chart Access To Accounting System
- Security and Access Plans | ConceptDraw PRO - Organizational ...
- Organizational Charts | How to Draw a Security and Access Floor ...
- Security Organizational Chart
- Audit Flowcharts | Flow Chart | Security and Access Plans | Sample ...
- Security and Access Plans | Physical Security Plan | Security Plans ...
- Security Department Organizational Chart
- Food security assessment - Flowchart | Flowcharts | Contoh ...
- Physical Security Plan | Security and Access Plans | Gym and Spa ...
- Security Control Network Flow Chart
- Physical Security Plan | Security and Access Plans | Security Plans ...
- How to Create a Network Security Diagram Using ConceptDraw ...
- Flow chart Example. Warehouse Flowchart | CORRECTIVE ...
- Physical Security Plan | Security Plans | How To Draw Building ...
- How to Draw a Security and Access Floor Plan | Security and Access ...
- Food security assessment - Flowchart | Weather - Vector stencils ...
- Fishbone Diagram | Ishikawa Fishbone Chart Security
- How to Draw a Security and Access Floor Plan | Office Layout Plans ...