This site uses cookies. By continuing to browse the ConceptDraw site you are agreeing to our Use of Site Cookies.

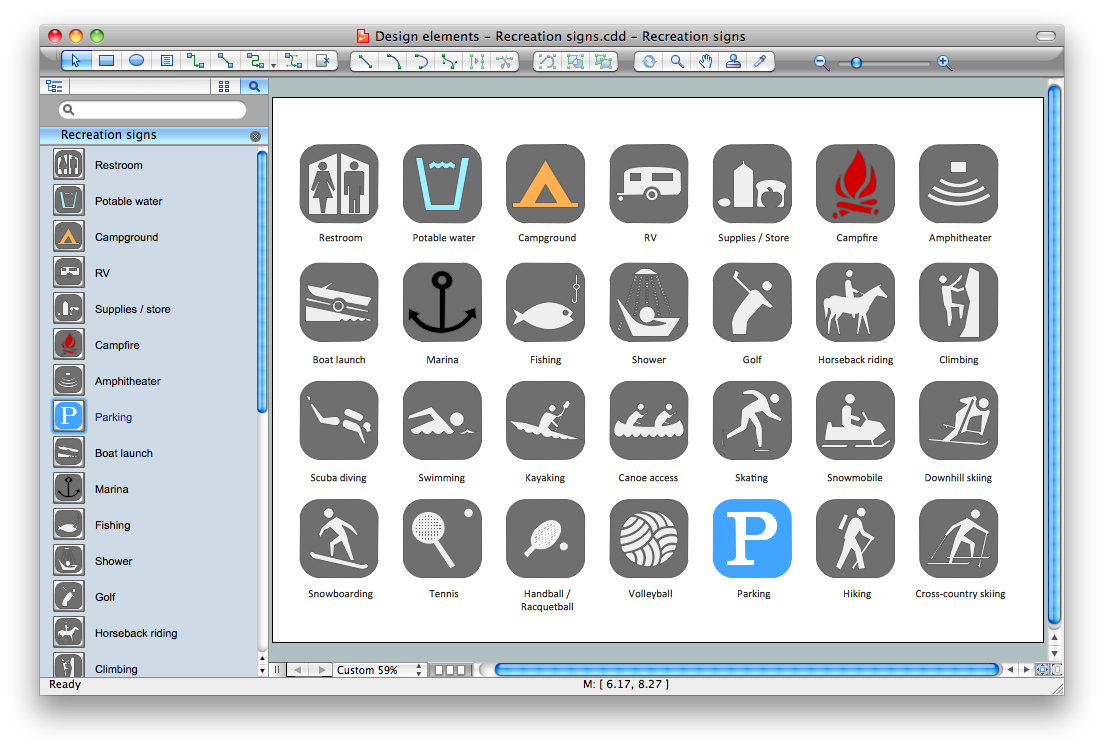
Sign Making Software

ConceptDraw DIAGRAM is a powerful sign making software thanks to the vector stencils library "Recreation signs". This library is included in the Directional Maps solution from the Maps area of ConceptDraw Solution Park.
Sign making software is very useful tool for professional sign-making business. Use ConceptDraw DIAGRAM and make sure that now sign making is easier and timesaving than ever!

Entity Relationship Diagram Examples

Create an Entity-Relationship (ER) model is to visually represent the structure of a business database, where data equates to entities (or objects) that are linked by defined relationships expressing dependencies and requirements. By nature it is an abstract visualization, the first step in the design process towards creating a logical and functional database.

ConceptDraw DIAGRAM diagramming and vector drawing software gives the ability to describe a database using the Entity-Relationship model. Entity-Relationship Diagram(ERD) solution from the Software Development area supplies the ConceptDraw DIAGRAM with icons advocated by Chen's and Crow’s Foot notation that can be used when describing a database.
How to Build an Entity Relationship Diagram (ERD)

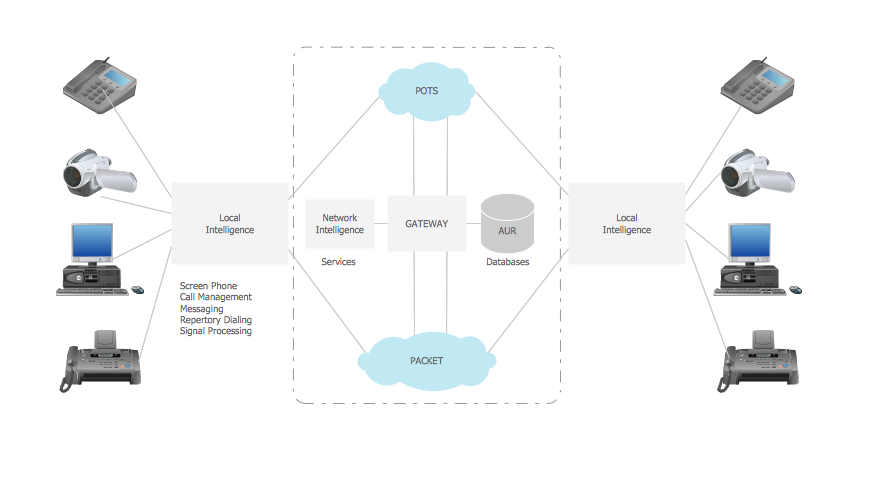
Telecommunication networks. Computer and Network Examples

A Telecommunications network is a network of nodes, links, trunks and telephone switches that are connected, operated by telephone companies and realize telephone, audio, visual and data communications among the users. The telecommunications network can also include Internet, microwave, wireless equipment.
This example was created in ConceptDraw DIAGRAM using the Computer and Networks Area of ConceptDraw Solution Park and shows the Telecommunications network.

UML Use Case Diagram Example. Registration System

The use case diagram (behavior scenarios, precedents) is the initial conceptual representation of the system during its design and development. This diagram consists of actors, use cases and relationships between them. When constructing a diagram, common notation elements can also be used: notes and extension mechanisms.

This sample was created in ConceptDraw DIAGRAM diagramming and vector drawing software using the UML Use Case Diagram library of the Rapid UML Solution from the Software Development area of ConceptDraw Solution Park.
This sample shows the types of user’s interactions with the system and is used at the registration and working with the database system.

Financial Trade UML Use Case Diagram Example

This sample represents the actors, use cases and dependencies between them, and also the relationships between use cases. There are used dependency and use case generalization associations on this UML diagram. Use case generalization is used when you have two similar use cases, but one of them does more than another.
This sample shows the work of the Financial Trade sphere and can be used by trading companies, commercial organizations, traders, different exchanges.

Entity Relationship Software

Entity Relationship Diagrams (ERD) illustrate the logical structure of databases.
The vector graphic diagrams produced when using the ConceptDraw ERD solution can be used in whitepapers, presentations, datasheets, posters, or any technical materials.
It is convenient to design ER Diagrams using ConceptDraw DIAGRAM software. ConceptDraw DIAGRAM extended with the Entity-Relationship Diagram (ERD) solution supports Chen's and Crow’s Foot notations that are often used to describe database structure.

Active Directory, network topology, Active Directory Domain Active Directory Diagrams

Active Directory, network topology, Active Directory Domain
Active Directory Diagrams solution significantly extends the capabilities of ConceptDraw DIAGRAM software with special Active Directory samples, convenient template and libraries of Active Directory vector stencils, common icons of sites and services, icons of LDPA elements, which were developed to help you in planning and modelling network structures and network topologies, in designing excellently looking Active Directory diagrams, Active Directory Structure diagrams, and Active Directory Services diagram, which are perfect way to visualize detailed structures of Microsoft Windows networks, Active Directory Domain topology, Active Directory Site topology, Organizational Units (OU), and Exchange Server organization.

Campus Area Networks (CAN). Computer and Network Examples

A campus network provides wireless access to the Internet or LAN to users located in two or more buildings or in the open space surrounding those buildings. A campus network is usually set in the campus of a university, but the same kind of planning and design can be applied for other purposes. For example, the campus network can used for an office or industrial park, in a public place like a supermarket with an entertainment center, even on a farm. Another form of temporary campus network can exist during special events such as music festivals or rallies.
The elementary campus networks arise spontaneously: the radio signals from the access points, which provide network inside the building are not limited to its walls, so any user in the backyard can also get wireless network access. The larger and more complex campus network may have additional access points in places specially chosen for serving clients, i.e., on the lawn in front of the college or in a coffee shop around the corner.

Amazon Web Services, AWS, Amazon cloud AWS Architecture Diagrams

Amazon Web Services, AWS, Amazon cloud
AWS Architecture Diagrams with powerful drawing tools and numerous predesigned Amazon icons and AWS simple icons is the best for creation the AWS Architecture Diagrams, describing the use of Amazon Web Services or Amazon Cloud Services, their application for development and implementation the systems running on the AWS infrastructure. The multifarious samples give you the good understanding of AWS platform, its structure, services, resources and features, wide opportunities, advantages and benefits from their use; solution’s templates are essential and helpful when designing, description and implementing the AWS infrastructure-based systems. Use them in technical documentation, advertising and marketing materials, in specifications, presentation slides, whitepapers, datasheets, posters, etc.

Credit Card Order Process Flowchart. Flowchart Examples

This sample was created in ConceptDraw DIAGRAM diagramming and vector drawing software using the Flowcharts solution from the Diagrams area of ConceptDraw Solution Park.
This sample shows the Flowchart of the Credit Card Order Process. On this diagram are used the flowchart symbols that represents the processes and documents. The flowchart symbols are connected with arrows.