KPIs and Metrics

Visualize Sales Data Using Sample Data

The Facts and KPIs

A KPI Dashboard Provides the Answers Your Sales Team

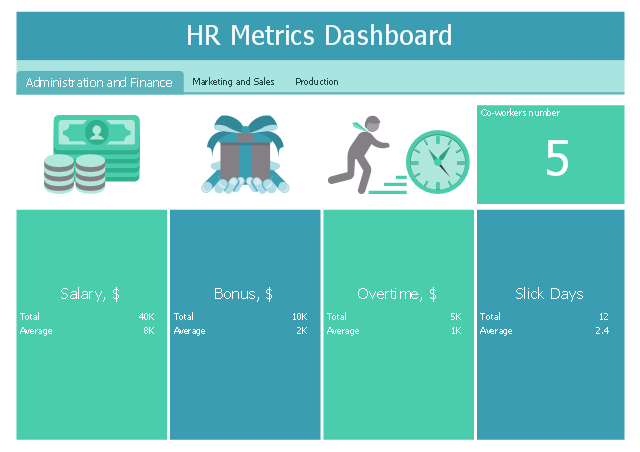
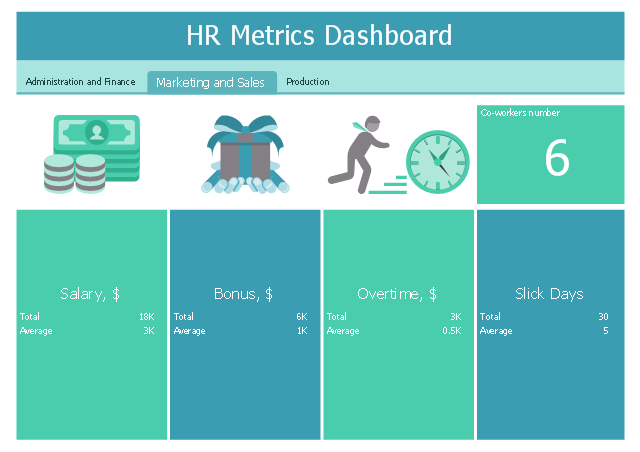
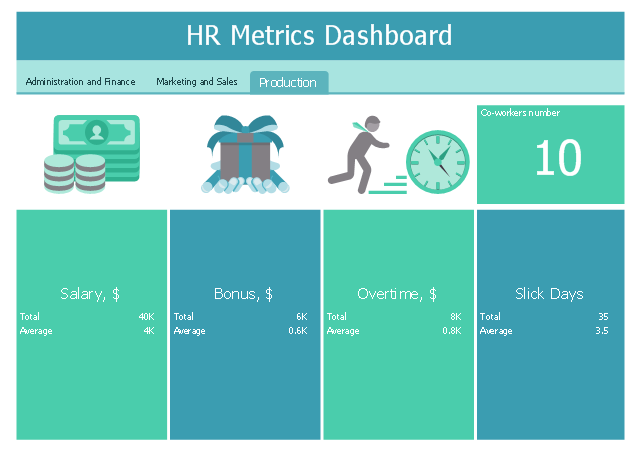
This performance dashboard sample shows HR metrics by departments: co-workrers number, salary, bonus, overtime, slick days.
"Human Resource (HR) metrics are measurements used to determine the value and effectiveness of HR initiatives, typically including such areas as turnover, training, return on human capital, costs of labor, and expenses per employee." [HR Metric. Wikipedia]
The human resources dashboard example "HR Metrics Dashboard" was designed using ConceptDraw PRO software extended with HR Dashboard solution from Management area of ConceptDraw Solution Park.
Administration and Finance
Marketing and Sales
Production
 HR Dashboard
The HR Dashboard solution extends ConceptDraw DIAGRAM functionality with powerful drawing tools and great collection of comprehensive vector design elements, icons, pictograms and objects, navigation elements, live objects of HR charts, HR indicators, and thematic maps. The range of HR Dashboards applications is extensive, among them the human resource management, recruitment, hiring process, human resource development. ConceptDraw DIAGRAM software is perfect for creation HR Dashboard with any goal you need. It gives you all opportunities for designing not only informative, but also professional looking and attractive HR Dashboards of any style and degree of detalization, that are perfect for using in presentations, reports and other thematic documents.
Financial Comparison Chart

 CRM Center Dashboard
The CRM Center Dashboard solution extends ConceptDraw DIAGRAM functionality with CRM software tools, large collection of CRM Charts live objects, CRM icons, CRM indicators, CRM maps and navigation elements, the set of professionally designed CRM samples and templates to help you construct your own CRM Dashboards and CRM Center Dashboards in a few minutes, to depict the current and actual data by connecting or refreshing the data source file. The customer management software ConceptDraw DIAGRAM makes you free to choose the style for your dashboard and to regulate the quantity of clipart on the diagram according to your taste.
 Meter Dashboard
Meter dashboard solution extends ConceptDraw DIAGRAM software with templates, samples and vector stencils library with meter indicators for drawing visual dashboards showing quantitative data.
 Business Intelligence Dashboard
Business Intelligence Dashboard solution extends the ConceptDraw DIAGRAM functionality with exclusive tools, numerous ready-to-use vector objects, samples and quick-start templates for creation professional Business Intelligence Dashboards, Business Intelligence Graphics, Business Intelligence Charts and Maps of different kinds. Design easy the BI dashboard, BI model or Dynamic chart in ConceptDraw DIAGRAM to monitor the company's work, to track the indicators corresponding your company's data, to display and analyze key performance indicators, to evaluate the trends and regularities of the processes occurring at the company.
- KPIs and Metrics | Visualize Sales Data Using Sample Data | Sales ...
- Dash Board For Metrics Sample
- Hr Metrics Dashboard Example
- Sales Dashboard Template | KPIs and Metrics | Sales Dashboard ...
- KPIs and Metrics | A KPI Dashboard | Sales KPI Dashboards ...
- Visualize Sales Data Using Sample Data | KPIs and Metrics | A KPI ...
- KPIs and Metrics | The Facts and KPIs | A KPI Dashboard | After ...
- Business Kpi Metrics Samples
- KPIs and Metrics | Business Intelligence Dashboard | The Facts and ...