 Bar Graphs
The Bar Graphs solution enhances ConceptDraw DIAGRAM functionality with templates, numerous professional-looking samples, and a library of vector stencils for drawing different types of Bar Graphs, such as Simple Bar Graph, Double Bar Graph, Divided Bar Graph, Horizontal Bar Graph, Vertical Bar Graph, and Column Bar Chart.
Chart Maker for Presentations

 School and Training Plans
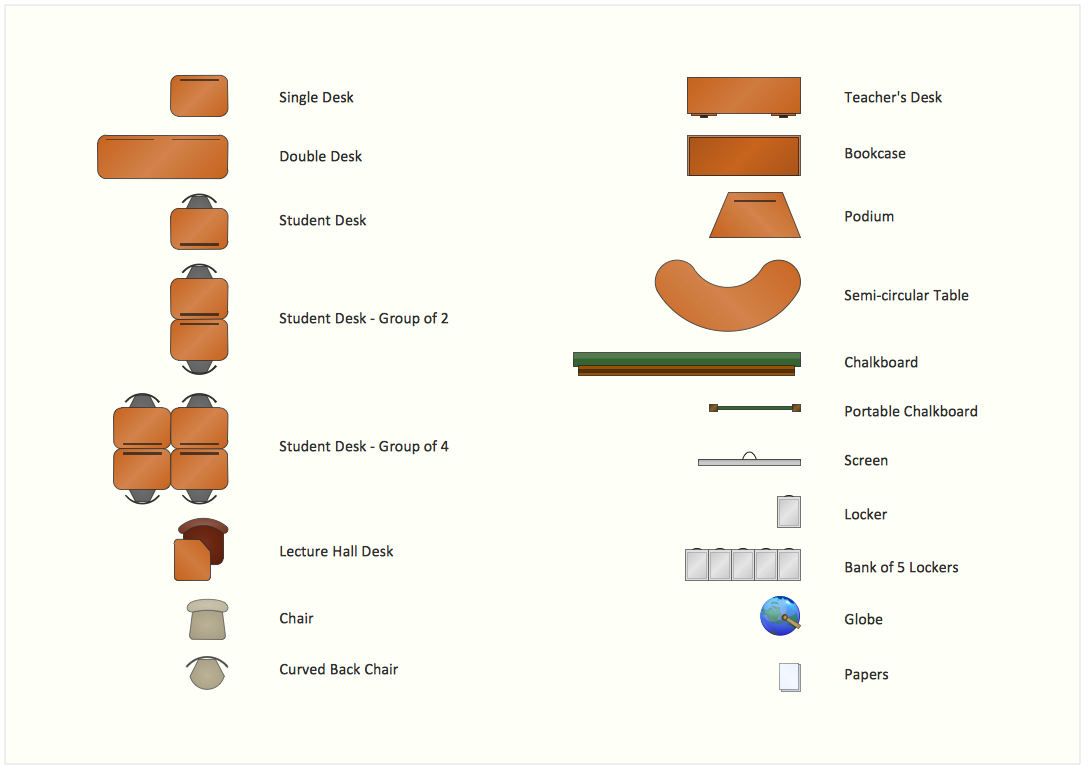
School and Training Plans solution enhances ConceptDraw DIAGRAM functionality with extensive drawing tools, numerous samples and examples, templates and libraries of classroom design elements for quick and professional drawing the School and Training plans, School Floor plans, Classroom Layout, Classroom Seating chart, Lecture Room plans of any complexity. Each offered classroom seating chart template is a real help for builders, designers, engineers, constructors, as well as teaching personnel and other teaching-related people in drawing Classroom Seating charts and Training Room layouts with ConceptDraw DIAGRAM classroom seating chart maker.
 Divided Bar Diagrams
The Divided Bar Diagrams Solution extends the capabilities of ConceptDraw DIAGRAM with templates, samples, and a library of vector stencils for drawing high impact and professional Divided Bar Diagrams and Graphs, Bar Diagram Math, and Stacked Graph.
 Area Charts
Area Charts are used to display the cumulative totals over time using numbers or percentages; or to show trends over time among related attributes. The Area Chart is effective when comparing two or more quantities. Each series of data is typically represented with a different color, the use of color transparency in an object’s transparency shows overlapped areas and smaller areas hidden behind larger areas.
 Football
The Football Solution extends ConceptDraw DIAGRAM software with samples, templates, and libraries of vector objects for drawing football (American) diagrams, plays schemas, and illustrations. It can be used to make professional looking documen
 Picture Graphs
Typically, a Picture Graph has very broad usage. They many times used successfully in marketing, management, and manufacturing. The Picture Graphs Solution extends the capabilities of ConceptDraw DIAGRAM with templates, samples, and a library of professionally developed vector stencils for designing Picture Graphs.
 Fishbone Diagram
Fishbone Diagrams solution extends ConceptDraw DIAGRAM software with templates, samples and library of vector stencils for drawing the Ishikawa diagrams for cause and effect analysis.
Interior Design. School Layout — Design Elements
 Food Court
Use the Food Court solution to create food art. Pictures of food can be designed using libraries of food images, fruit art and pictures of vegetables.
 Cafe and Restaurant Floor Plans
Restaurants and cafes are popular places for recreation, relaxation, and are the scene for many impressions and memories, so their construction and design requires special attention. Restaurants must to be projected and constructed to be comfortable and e
 Computer and Network Package
Computer and Network Package is a large set of valuable graphical solutions from ConceptDraw Solution Park, developed and specially selected to help computer network specialists and IT professionals to realize their daily work the most efficiently and quickly. This package contains extensive set of graphic design tools, ready-to-use vector elements, built-in templates and samples for designing professional-looking diagrams, charts, schematics and infographics in a field of computer network technologies, cloud computing, vehicular networking, wireless networking, ensuring networks security and networks protection. It is useful for designing different floor plans and layout plans for homes, offices, hotels and instantly construction detailed schemes of computer networks and wireless networks on them, for making professional-looking and colorful Pie Charts, Bar Graphs and Line Charts visualizing the relevant information and data.
 ConceptDraw Solution Park
ConceptDraw Solution Park collects graphic extensions, examples and learning materials
Entity Relationship Diagram - ERD - Software for Design Crows Foot ER Diagrams
_Win_Mac.png)

 Sport Field Plans
Sport Field Plans solution extends ConceptDraw DIAGRAM with samples, templates and libraries of ready-made design elements for developing layouts of sport fields, recreation areas, playground layouts plans, and for professional drawing various sport field plans — for football, basketball, volleyball, golf, baseball, tennis, etc. Depict all your playground layout ideas easily and decisively implement the playground layout designs. Use the final colorful, strict and accurate ConceptDraw's playground layouts when designing the building documentation, brochures, booklets, advertising materials, sports editions, sport maps, business plans, on web sites of sport complexes, sport centers, hotels, etc.
- Bar Graph Example For High Schools
- School and Training Plans | Football | Bar Graphs | Activity Diagram ...
- Percentage Pie Chart . Pie Chart Examples | Percentage of U.S. high ...
- Workflow Diagram Examples | School and Training Plans | Bar ...
- Bar Graph Showing Security Services In School
- Bar Graphs | Data-driven charts - Vector stencils library | Chart ...
- Bar Graphs | Chart Examples | Chart Templates | Percentage Vs ...
- Percent of Students achieved a 36 on ACT | Percentage of U.S. high ...
- Chart Maker for Presentations | Bar Graphs | Column Chart Software ...
- Baseball Diagram – Baseball Field – Corner View – Sample | Bar ...
- Schedule pie chart - Daily action plan | Chart Examples | Bar Graphs ...
- High School Gymnasium Floor Plans
- Bar Diagram Math | Pie Charts | Divided Bar Diagrams | Mangement ...
- A Simple Erd Diagram Of High School Database System
- High School Basketball Court Dimensions Pdf
- Pie Charts | Bar Diagram Math | Organizational Charts with ...
- Example Of Fishbone Diagram In School
- Physics | Software development with ConceptDraw PRO | Bar ...
- Bar Graph | Global competitiveness index infrastructure score | Bar ...
- Value Chain Analysis Example School