HelpDesk
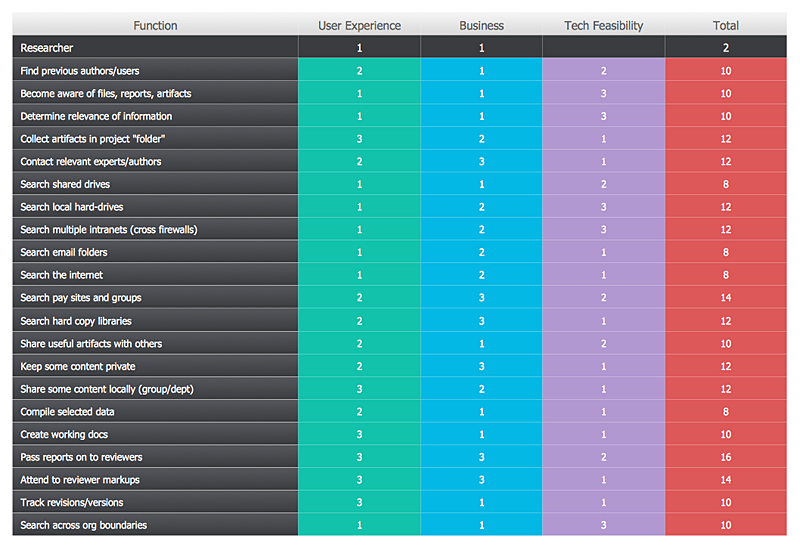
How To Create a Prioritization Matrix
HelpDesk
How to Manage Problem Solving Using Seven Management and Planning Tools


 Pyramid Diagrams
Pyramid Diagrams solution extends ConceptDraw DIAGRAM software with templates, samples and library of vector stencils for drawing the marketing pyramid diagrams.
 Circular Arrows Diagrams
Circular Arrows Diagrams solution extends ConceptDraw DIAGRAM with extensive drawing tools, predesigned samples, Circular flow diagram template for quick start, and a library of ready circular arrow vector stencils for drawing Circular Arrow Diagrams, Segmented Cycle Diagrams, and Circular Flow Diagrams. The elements in this solution help managers, analysts, business advisers, marketing experts, scientists, lecturers, and other knowledge workers in their daily work.
Pyramid Chart Examples

 Status Dashboard
Status dashboard solution extends ConceptDraw DIAGRAM software with templates, samples and vector stencils libraries with graphic indicators for drawing the visual dashboards showing status data.
- Business Productivity Area | Pyramid Chart Examples | Sales ...
- PROBLEM ANALYSIS. Prioritization Matrix | PROBLEM ANALYSIS ...
- SWOT Matrix Template | Matrices | How To Create the Involvement ...
- Authority Matrix Diagram Software | SWOT and TOWS Matrix ...
- Marketing | Mind Map Exchange | Sales Dashboard | Sales Plan
- Root Cause Analysis | PROBLEM ANALYSIS Prioritization Matrix ...
- PROBLEM ANALYSIS. Prioritization Matrix | Authority Matrix ...
- PROBLEM ANALYSIS. Prioritization Matrix | Prioritization matrix ...
- PROBLEM ANALYSIS. Prioritization Matrix | Prioritization Matrix ...
- How To Create the Involvement Matrix | PROBLEM ANALYSIS ...
- Decision Making | PROBLEM ANALYSIS Prioritization Matrix ...
- Corrective Action Planning | PROBLEM ANALYSIS Prioritization ...
- How To Create the Prioritization Matrix | Prioritization Matrix | Design ...
- Relations diagram - Sales process | Marketing | Seven Management ...
- Activity Network (PERT) Chart | CORRECTIVE ACTIONS PLANNING ...
- PROBLEM ANALYSIS Prioritization Matrix | Seven Management and ...
- Marketing | Seven Management and Planning Tools | Entity ...
- Seven Management and Planning Tools | Marketing | Marketing and ...
- PROBLEM ANALYSIS Prioritization Matrix | Prioritization matrix ...
- Seven Management and Planning Tools | PROBLEM ANALYSIS ...