"A commercial building is a building that is used for commercial use. Types can include office buildings, warehouses, or retail (i.e. convenience stores, 'big box' stores, shopping malls, etc.). In urban locations, a commercial building often combines functions, such as an office on levels 2-10, with retail on floor 1. Local authorities commonly maintain strict regulations on commercial zoning, and have the authority to designate any zoned area as such. A business must be located in a commercial area or area zoned at least partially for commerce." [Commercial building. Wikipedia]
The warehouse floor plan example "Shipping, receiving and storage" was created using the ConceptDraw PRO diagramming and vector drawing software extended with the Plant Layout Plans solution from the Building Plans area of ConceptDraw Solution Park.
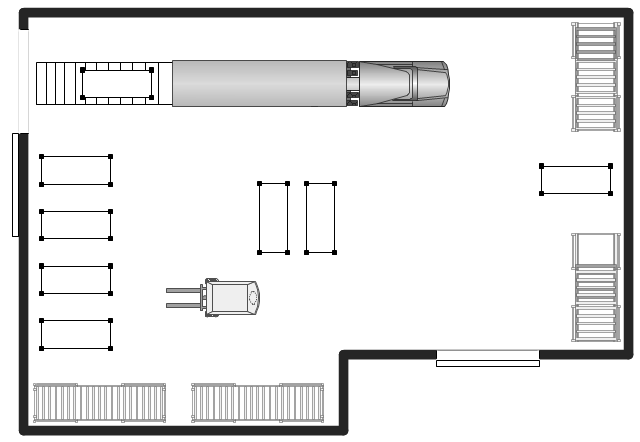
The warehouse floor plan example "Shipping, receiving and storage" was created using the ConceptDraw PRO diagramming and vector drawing software extended with the Plant Layout Plans solution from the Building Plans area of ConceptDraw Solution Park.
Warehouse floor plan
 Azure Architecture
Azure Architecture solution bundles into one handy tool everything you need to create effective Azure Architecture diagrams. It adds the extra value to versatile ConceptDraw PRO software and extends the users capabilities with comprehensive collection of Microsoft Azure themed graphics, logos, preset templates, wide array of predesigned vector symbols that covers the subjects such as Azure management, Azure storage, and Azure services, amongst others, and allow you to illustrate Azure Architecture diagrams at any degree of complexity, to present visually your Azure cloud system architecture with professional style, to design Azure cloud topology, to document Windows Azure Architecture and Azure Cloud System Architecture, to visualize the great abilities and work of Microsoft Azure Cloud System and Azure services.
"The Ethernet physical layer is the physical layer component of the Ethernet family of computer network standards.
The Ethernet physical layer evolved over a considerable time span and encompasses quite a few physical media interfaces and several magnitudes of speed. The speed ranges from 1 Mbit/ s to 100 Gbit/ s, while the physical medium can range from bulky coaxial cable to twisted pair and optical fiber. In general, network protocol stack software will work similarly on all physical layers.
10-gigabit Ethernet was already used in both enterprise and carrier networks by 2007, with 40 Gbit/ s and 100 Gbit/ s Ethernet ratified. ...
Many Ethernet adapters and switch ports support multiple speeds, using autonegotiation to set the speed and duplex for the best values supported by both connected devices. If auto-negotiation fails, a multiple-speed device will sense the speed used by its partner, but will assume half-duplex. A 10/ 100 Ethernet port supports 10BASE-T and 100BASE-TX. A 10/ 100/ 1000 Ethernet port supports 10BASE-T, 100BASE-TX, and 1000BASE-T." [Ethernet physical layer. Wikipedia]
The LAN equipment and cabling layout floorplan example "Ethernet local area network layout floor plan" was created using the ConceptDraw PRO diagramming and vector drawing software extended with the Network Layout Floor Plans solution from the Computer and Networks area of ConceptDraw Solution Park.
www.conceptdraw.com/ solution-park/ computer-networks-layout-floor-plans
Ethernet LAN layout floorplan (1)
-ethernet-local-area-network-layout-floor-plan.png--diagram-flowchart-example.png)
Ethernet LAN layout floorplan (2)
-ethernet-local-area-network-layout-floor-plan.png--diagram-flowchart-example.png)
 Fishbone Diagrams
The Fishbone Diagrams solution extends ConceptDraw PRO v10 software with the ability to easily draw the Fishbone Diagrams (Ishikawa Diagrams) to clearly see the cause and effect analysis and also problem solving. The vector graphic diagrams produced using this solution can be used in whitepapers, presentations, datasheets, posters, and published technical material.
 Seven Management and Planning Tools
Seven Management and Planning Tools solution extends ConceptDraw PRO and ConceptDraw MINDMAP with features, templates, samples and libraries of vector stencils for drawing management mind maps and diagrams.
 SWOT and TOWS Matrix Diagrams
SWOT and TOWS Matrix Diagrams solution extends ConceptDraw PRO and ConceptDraw MINDMAP software with features, templates, samples and libraries of vector stencils for drawing SWOT and TOWS analysis matrices and mind maps.
- Store Layout Software | 3d Retail Planogram
- Retail Store Layout Pdf
- Store Layout Software | Planogram Software and Retail Plan ...
- Retail Store Layout Design Software
- Planogram | Store Layout Software | Microsoft Azure | Planogram ...
- Retail Store Outlet Layout
- Store Layout Software | Planogram | Process Flowchart | Retail ...
- Retail Store Layout Design Free
- Planogram Software and Retail Plan Software | Store Layout ...
- Store Layout Software | Windows Azure | Flow chart Example ...
- Store Layout Software | Home Design Software | Planogram | Retail ...
- Store Layout Software | Example of DFD for Online Store (Data Flow ...
- Planogram | Planogram Software and Retail Plan Software | Store ...
- Retail Store Layout Designs
- Store Layout Software | Shipping, receiving and storage | School ...
- Planogram Software and Retail Plan Software | Planogram | Store ...
- Flow chart Example. Warehouse Flowchart | Store Layout Software ...
- Store Layout Software | Example of DFD for Online Store (Data Flow ...
- Store Layout Software | Process Flowchart | Example of DFD for ...