 Sales Dashboard
Sales Dashboard solution extends ConceptDraw PRO software with templates, samples and library of vector stencils for drawing the visual dashboards of sale metrics and key performance indicators (KPI).
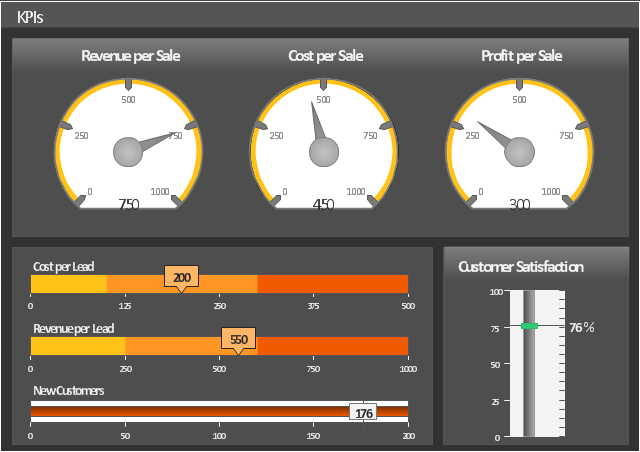
This sales KPIs dashboard sample indicates sale group effectiveness by different parameters, such as Revenue per Sale, Cost per Sale, Profit per Sale, Customer Satisfaction, Cost per Lead and Revenue per Lead using gauge and slider indicators.
The performance dashboard example "Sales KPIs" was created using the ConceptDraw PRO diagramming and vector drawing software extended with the Sales Dashboard solution from the Marketing area of ConceptDraw Solution Park.
The performance dashboard example "Sales KPIs" was created using the ConceptDraw PRO diagramming and vector drawing software extended with the Sales Dashboard solution from the Marketing area of ConceptDraw Solution Park.
Sales dashboard
Collaboration in a Project Team

 Business Process Diagrams
Business Process Diagrams solution extends the ConceptDraw PRO BPM software with RapidDraw interface, templates, samples and numerous libraries based on the BPMN 1.2 and BPMN 2.0 standards, which give you the possibility to visualize equally easy simple and complex processes, to design business models, to quickly develop and document in details any business processes on the stages of project’s planning and implementation.
HelpDesk
How to Export Project Data to MS Excel Worksheet

HelpDesk
How to Shift Dates in ConceptDraw PROJECT

- Sales Dashboard | Meter Dashboard | Sales Dashboard Examples ...
- Sales metrics and KPIs - Visual dashboard | Sales KPIs ...
- Website KPIs - Visual dashboard | A KPI Dashboard | Sales KPIs ...
- Cost Revenue Dashboard
- KPIs and Metrics | A KPI Dashboard | Sales KPI Dashboards ...
- Design elements - Meter indicators | Meter indicators 2 - Vector ...
- Sales Dashboard | | | Dashboard Sales Profit
- Fishbone Diagram Profit
- Performance Indicators | What is a KPI? | Sales KPIs - Performance ...
- Sales KPIs - Performance dashboard | Sales geographically ...
- A KPI Dashboard | A KPI Dashboard Provides the Answers Your ...
- The Facts and KPIs | KPIs and Metrics | KPI Dashboard | Kpis
- How to Create a Sales Dashboard Using ConceptDraw PRO | Sales ...
- Sales dashboard - Vector stencils library | Sales dashboard - Vector ...
- Sales dashboard - Vector stencils library | Sales dashboard - Vector ...
- Sales metrics and KPIs - Visual dashboard | Sales dashboard ...
- Sales dashboard - Vector stencils library | Sales revenue ...
- Meter Dashboard | Design elements - Sales dashboard | Sales ...
- How to Create a Sales Dashboard Using ConceptDraw PRO | Sales ...
- Sales dashboard - Vector stencils library | Sales dashboard - Vector ...