The vector stencils library "Sales dashboard" contains 27 charts and graphic indicators.
Use it for drawing sales dashboards in the ConceptDraw PRO diagramming and vector drawing software extended with the Sales Dashboard solution from the Marketing area of ConceptDraw Solution Park.
Use it for drawing sales dashboards in the ConceptDraw PRO diagramming and vector drawing software extended with the Sales Dashboard solution from the Marketing area of ConceptDraw Solution Park.
Column Chart

Bar Chart

Line Chart

Divided Bar

Pie Chart

Two Bubbles Indicator

Speedometer Gauge 1

Speedometer Gauge 2

Speedometer Gauge 3

Speedometer Gauge 4

Slider Horizontal 1

Slider Horizontal 2

Slider Horizontal 3

Slider Horizontal 4

Slider Horizontal 5

Slider Horizontal 6

Slider Horizontal 7

Slider Vertical 1

Slider Vertical 2

Slider Vertical 3

Bullet 1

Bullet 2

Bullet 3

Bullet 4

Backgroung 1

Backgroung 2

Backgroung 3

The vector stencils library "Sales dashboard" contains 27 charts and graphic indicators.
Use it for drawing sales dashboards in the ConceptDraw PRO diagramming and vector drawing software extended with the Sales Dashboard solution from the Marketing area of ConceptDraw Solution Park.
Use it for drawing sales dashboards in the ConceptDraw PRO diagramming and vector drawing software extended with the Sales Dashboard solution from the Marketing area of ConceptDraw Solution Park.
Column Chart
Bar Chart
Line Chart
Divided Bar
Pie Chart
Two Bubbles Indicator
Speedometer Gauge 1
Speedometer Gauge 2
Speedometer Gauge 3
Speedometer Gauge 4
Slider Horizontal 1
Slider Horizontal 2
Slider Horizontal 3
Slider Horizontal 4
Slider Horizontal 5
Slider Horizontal 6
Slider Horizontal 7
Slider Vertical 1
Slider Vertical 2
Slider Vertical 3
Bullet 1
Bullet 2
Bullet 3
Bullet 4
Backgroung 1
Backgroung 2
Backgroung 3
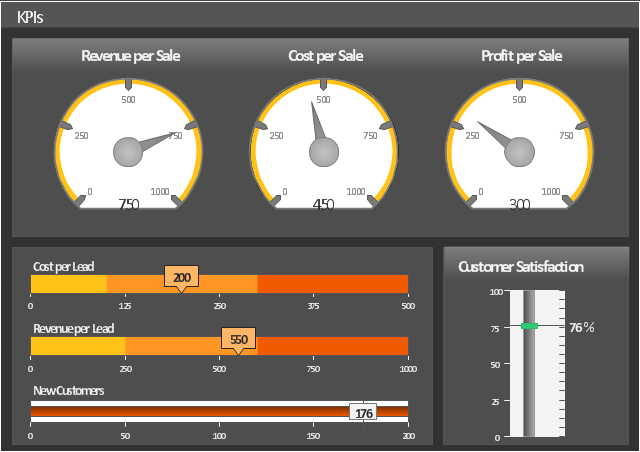
This sale dashboard example contains KPIs and sales effectiveness metrics visual indicators: speedometer gauge, dial, slider, level meter and bullet indicators.
"Sales effectiveness refers to the ability of a company’s sales professionals to “win” at each stage of the customer’s buying process, and ultimately earn the business on the right terms and in the right timeframe.
Improving sales effectiveness is not just a sales function issue; it’s a company issue, as it requires deep collaboration between sales and marketing to understand what’s working and not working, and continuous improvement of the knowledge, messages, skills, and strategies that sales people apply as they work sales opportunities.
Sales effectiveness has historically been used to describe a category of technologies and consulting services aimed at helping companies improve their sales results.
Many companies are creating sales effectiveness functions and have even given people titles such as VP of Sales Effectiveness." [Sales effectiveness. Wikipedia]
The example "Sales metrics and KPIs" was created using the ConceptDraw PRO diagramming and vector drawing software extended with the Meter Dashboard solution from the area "What is a Dashboard" of ConceptDraw Solution Park.
Sales dashboard

The vector stencils library "Sales dashboard" contains 27 charts and graphic indicators.
Use it for drawing sales dashboards in the ConceptDraw PRO diagramming and vector drawing software extended with the Sales Dashboard solution from the Marketing area of ConceptDraw Solution Park.
Use it for drawing sales dashboards in the ConceptDraw PRO diagramming and vector drawing software extended with the Sales Dashboard solution from the Marketing area of ConceptDraw Solution Park.
Column Chart
Bar Chart
Line Chart
Divided Bar
Pie Chart
Two Bubbles Indicator
Speedometer Gauge 1
Speedometer Gauge 2
Speedometer Gauge 3
Speedometer Gauge 4
Slider Horizontal 1
Slider Horizontal 2
Slider Horizontal 3
Slider Horizontal 4
Slider Horizontal 5
Slider Horizontal 6
Slider Horizontal 7
Slider Vertical 1
Slider Vertical 2
Slider Vertical 3
Bullet 1
Bullet 2
Bullet 3
Bullet 4
Backgroung 1
Backgroung 2
Backgroung 3
The vector stencils library "Sales dashboard" contains 27 charts and indicators: bar charts, line graphs, gauges, sliders, pie charts, divided bar diagrams, bubble indicators, bullet indicators.
The design elements library "Sales dashboard" for the ConceptDraw PRO diagramming and vector drawing software is included in the Sales Dashboard solution from the Marketing area of ConceptDraw Solution Park.
The design elements library "Sales dashboard" for the ConceptDraw PRO diagramming and vector drawing software is included in the Sales Dashboard solution from the Marketing area of ConceptDraw Solution Park.
Sales dashboard charts and indicators

This sales KPIs dashboard sample indicates sale group effectiveness by different parameters, such as Revenue per Sale, Cost per Sale, Profit per Sale, Customer Satisfaction, Cost per Lead and Revenue per Lead using gauge and slider indicators.
The performance dashboard example "Sales KPIs" was created using the ConceptDraw PRO diagramming and vector drawing software extended with the Sales Dashboard solution from the Marketing area of ConceptDraw Solution Park.
The performance dashboard example "Sales KPIs" was created using the ConceptDraw PRO diagramming and vector drawing software extended with the Sales Dashboard solution from the Marketing area of ConceptDraw Solution Park.
Sales dashboard
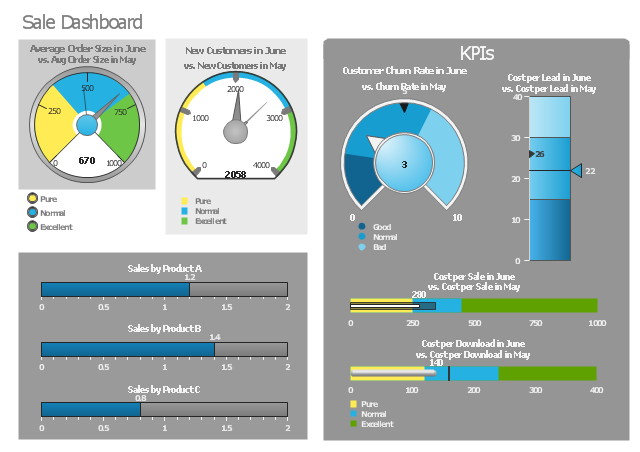
The example "Sale dashboard" displays the KPIs and sales effectiveness metrics visual indicators: speedometer gauge, dial, slider, level meter and bullet indicators.
"Sales intelligence (SI) refers to technologies, applications and practices for the collection, integration, analysis, and presentation of information to help salespeople keep up to date with clients, prospect data and drive business. In addition to providing metrics for win-loss and sales confidence, SI can present contextually relevant customer and product information. ...
Top performing companies have implemented sales intelligence programs to improve the quality and quantity of sales leads. SI contextualizes opportunities by providing relevant industry, corporate and personal information. Frequently SI's fact-based information is integrated or includes Customer Relationship Management (CRM).
Although some aspects of sales intelligence overlaps business intelligence (BI), SI is specifically designed for the use of salespeople and sales managers. Unlike customer relationship management (CRM) and traditional business intelligence (BI) applications, SI provides real-time analysis of current sales data and assists with suggesting and delivering actionable, relevant information." [Sales intelligence. Wikipedia]
The example "Sale dashboard" was created using the ConceptDraw PRO diagramming and vector drawing software extended with the Meter Dashboard solution from the area "What is a Dashboard" of ConceptDraw Solution Park.
Sales dashboard
This sales performance dashboard example includes KPIs indicators and business metrics charts: bullet indicator - "Win Ratio vs. Last Year", gauge (speedometer) indicators - "Open Deals vs. Last Year" and "YTD Sales vs. Last Year", column chart - "Leads created", line chart - "Opportunities Won", alarm indicators - "Sales Ratios", horizontal bar chart - "Top Products in Revenue".
The example "Sales performance dashboard" was created using the ConceptDraw PRO diagramming and vector drawing software extended with the Sales Dashboard solution from the Marketing area of ConceptDraw Solution Park.
www.conceptdraw.com/ solution-park/ marketing-sales-dashboard
The example "Sales performance dashboard" was created using the ConceptDraw PRO diagramming and vector drawing software extended with the Sales Dashboard solution from the Marketing area of ConceptDraw Solution Park.
www.conceptdraw.com/ solution-park/ marketing-sales-dashboard
Sales dashboard

The vector stencils library "Sales dashboard" contains 27 charts and graphic indicators.
Use it for drawing sales dashboards in the ConceptDraw PRO diagramming and vector drawing software extended with the Sales Dashboard solution from the Marketing area of ConceptDraw Solution Park.
Use it for drawing sales dashboards in the ConceptDraw PRO diagramming and vector drawing software extended with the Sales Dashboard solution from the Marketing area of ConceptDraw Solution Park.
Column Chart
Bar Chart
Line Chart
Divided Bar
Pie Chart
Two Bubbles Indicator
Speedometer Gauge 1
Speedometer Gauge 2
Speedometer Gauge 3
Speedometer Gauge 4
Slider Horizontal 1
Slider Horizontal 2
Slider Horizontal 3
Slider Horizontal 4
Slider Horizontal 5
Slider Horizontal 6
Slider Horizontal 7
Slider Vertical 1
Slider Vertical 2
Slider Vertical 3
Bullet 1
Bullet 2
Bullet 3
Bullet 4
Backgroung 1
Backgroung 2
Backgroung 3
- Design elements - Sales dashboard | Design elements - Meter ...
- Sales dashboard - Vector stencils library | Android User Interface ...
- Sales dashboard - Vector stencils library | Sales dashboard - Vector ...
- Sales dashboard - Vector stencils library
- Sales dashboard - Vector stencils library | Sales dashboard - Vector ...
- KPI Dashboard | Dashboard | Sales dashboard - Vector stencils ...
- How to Draw a Line Chart Quickly | Sales dashboard - Vector ...
- Design elements - Sales dashboard | Meter indicators 2 - Vector ...
- Sales metrics and KPIs - Visual dashboard | Sales dashboard ...