This site uses cookies. By continuing to browse the ConceptDraw site you are agreeing to our Use of Site Cookies.

Venn Diagram Template for Word

This template shows the Venn Diagram. It was created in ConceptDraw PRO diagramming and vector drawing software using the ready-to-use objects from the Venn Diagrams Solution from the "What is a Diagram" area of ConceptDraw Solution Park.

Venn diagram, draw logical relations Venn Diagrams

Venn diagram, draw logical relations
Venn Diagrams are actively used to illustrate simple set relationships in set theory and probability theory, logic and statistics, mathematics and computer science, linguistics, sociology, and marketing. Venn Diagrams are also often used to visually summarize the status and future viability of a project.
HelpDesk

How to Create a Venn Diagram in ConceptDraw PRO

Venn diagrams were invented by John Venn as a method of depicting relationships between different components. A Venn diagram consists of two or more circles. Each circle represents a specific group or set. The entities which are depicted by circles generally have some common characteristics. A Venn Diagram shows all the possible logical relations between these entities. Any properties that belong to more than one set should be indicated in the sections where the circles overlap. A Venn Diagram can be useful to visually summarize the status and future viability of a project. ConceptDraw PRO allows you to make a Venn diagrams using the Venn Diagrams solution.

Venn Diagram Examples for Problem Solving. Computer Science. Chomsky Hierarchy

A Venn diagram, sometimes referred to as a set diagram, is a diagramming style used to show all the possible logical relations between a finite amount of sets. In mathematical terms, a set is a collection of distinct objects gathered together into a group, which can then itself be termed as a single object. Venn diagrams represent these objects on a page as circles or ellipses, and their placement in relation to each other describes the relationships between them.
The Venn diagram example below visualizes the the class of language inclusions described by the Chomsky hierarchy.

Venn Diagram Template

It's impossible to overestimate the usefulness and convenience of using the ready templates when you create your own diagrams and charts. And Venn Diagrams are not exception. ConceptDraw PRO diagramming and vector drawing software presents the Venn Diagrams solution from "What is a Diagram" area which offers a set of Venn Diagram templates and samples. Use the suitable Venn Diagram Template to create your own Venn Diagram of any complexity.

Cylinder Venn Diagram

You need design Cylinder Venn Diagram? Nothing could be easier with ConceptDraw PRO diagramming and vector drawing software extended with Venn Diagrams Solution from the “What is a Diagram” Area. ConceptDraw PRO allows you to design various Venn Diagrams including Cylinder Venn Diagrams.

What Is a Circle Spoke Diagram

What Is a Circle Spoke Diagram? It is a diagram which have a central item surrounded by other items in a circle. The Circle Spoke Diagrams are often used to show the features or components of the central item in marketing and management documents and presentations. ConceptDraw PRO extended with Circle-Spoke Diagrams Solution from the "What is a Diagram" Area is the best software for creating Circle-Spoke Diagrams.

3 Circle Venn Diagram. Venn Diagram Example

This template shows the Venn Diagram. It was created in ConceptDraw PRO diagramming and vector drawing software using the ready-to-use objects from the Venn Diagrams Solution from the "What is a Diagram" area of ConceptDraw Solution Park.
Venn Diagrams visualize all possible logical intersections between several sets and are widely used in mathematics, logic, statistics, marketing, sociology, etc.

Multi Layer Venn Diagram. Venn Diagram Example

To visualize the relationships between subsets of the universal set you can use Venn diagrams. To construct one, you should divide the plane into a number of cells using n figures. Each figure in the chart represents a single set of, and n is the number of represented sets. Splitting is done in a way that there is one and only one cell for any set of these figures, the points of which belong to all the figures from the set and do not belong to others. The plane on which the figures are represented, is the universal set U. Thus, the point which does not belong to any of the figures, belongs only to U.

Circles Venn Diagram

This example shows the 4 Circle Venn Diagram. The Venn Diagram visualizes all possible logical relations between several sets. The sets are represented as circles on the Venn Diagram. On this example you can see the intersections of 4 sets. Venn Diagrams are widely used in mathematics, logic, statistics, marketing, sociology, etc.

Interactive Venn Diagram

Venn Diagrams Solution offers you the Venn Diagrams library of ready-to-use vector objects and large collection of templates and samples allowing you create your own Interactive Venn Diagram in minutes.
Venn Diagrams designed in ConceptDraw PRO are visual, bright, colorful, so they can be successfully used in different reports, appearances on the conferences, meetings.

Venn Diagram

Venn diagrams are illustrations used in the branch of mathematics known as set theory. They show the mathematical or logical relationship between different groups of things (sets). A Venn diagram shows all the possible logical relations between the sets.

Venn Diagram Maker

ConceptDraw PRO diagramming and vector drawing software extended with Venn Diagrams solution from the "What is a Diagram" area of ConceptDraw Solution Park is a powerful Venn Diagram maker. Create fast and easy your own Venn Diagrams to visualize: all the possible logical relations between sets, simple set relationships in logic, statistics, mathematics, sociology, marketing, summarize the status and future viability of a project.
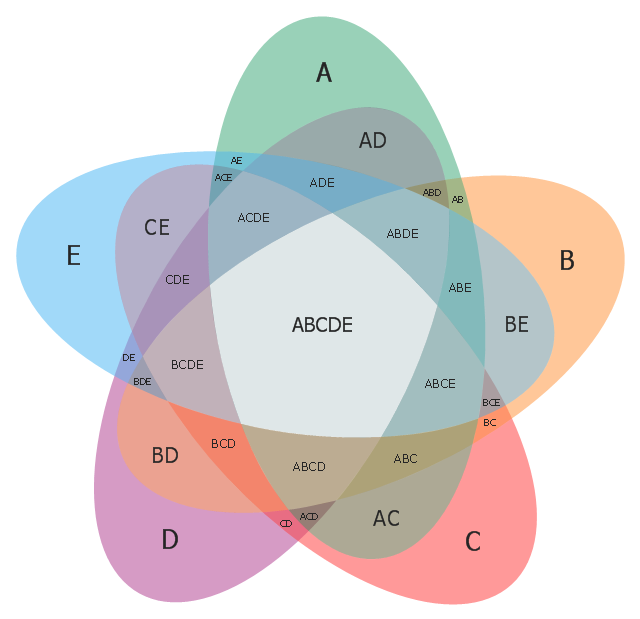
Use this template to design your five set Venn diagrams.
"Five-set Venn diagram using congruent ellipses in a radially symmetrical arrangement devised by Branko Grünbaum. Labels have been simplified for greater readability." [Venn diagram. Wikipedia]
The template "5-set Venn diagram" for the ConceptDraw PRO diagramming and vector drawing software is included in the Venn Diagrams solution from the area "What is a Diagram" of ConceptDraw Solution Park.
Template
Template,

3 Circle Venn. Venn Diagram Example

This example shows the 3 Circle Venn Diagram. The Venn Diagrams visualize all possible logical intersections between several sets. On this example you can see the intersections of 3 sets. Venn Diagrams are widely used in mathematics, logic, statistics, marketing, sociology, etc.