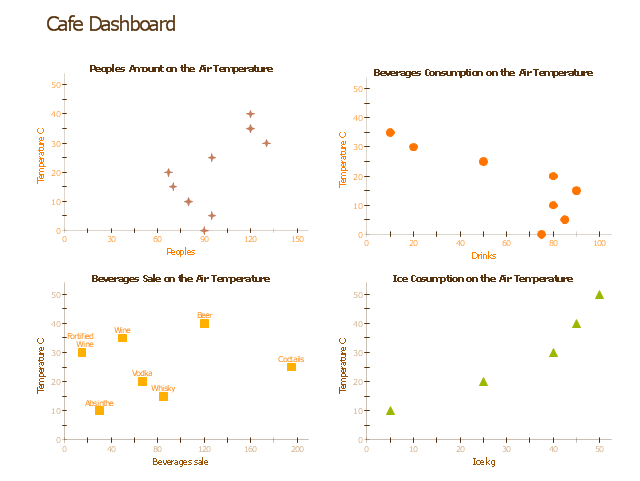
"A performance metric is that which determines an organization's behavior and performance. Performance metrics measure of an organization's activities and performance. It should support a range of stakeholder needs from customers, shareholders to employees. While traditionally many metrics are finance based, inwardly focusing on the performance of the organization, metrics may also focus on the performance against customer requirements and value. In project management, performance metrics are used to assess the health of the project and consist of the measuring of seven criteria: safety, time, cost, resources, scope, quality, and actions. Developing performance metrics usually follows a process of: 1. Establishing critical processes/ customer requirements. 2. Identifying specific, quantifiable outputs of work. 3. Establishing targets against which results can be scored." [Performance metric. Wikipedia] The example "Cafe performance metrics vs. air temperature - Visual dashboard" was created using the ConceptDraw PRO diagramming and vector drawing software extended with the Corellation Dashboard solution from the area "What is a Dashboard" of ConceptDraw Solution Park.
Visual dashboard
Competitor Analysis

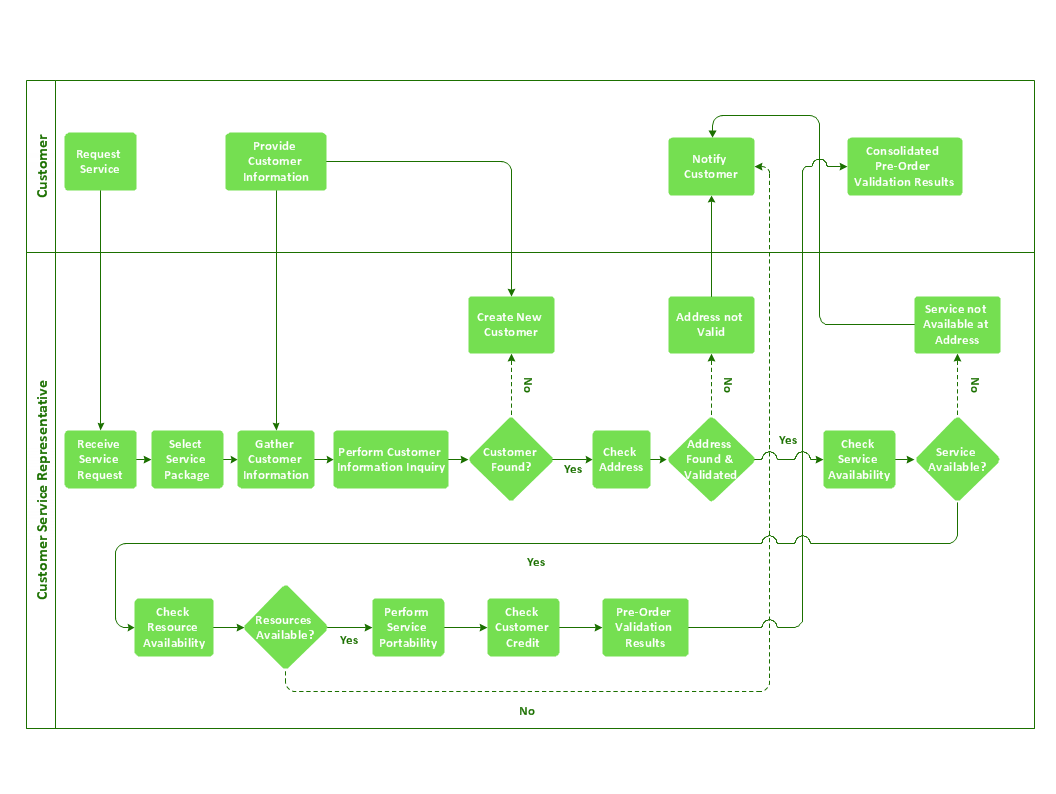
Cross-Functional Flowchart Basics
 Business Productivity Area
Business Productivity Solutions extend ConceptDraw products with tools for making presentations, conducting meetings, preparing documents, brainstorming, or building new strategies.
Cross-Functional Flowchart - The easiest way to draw crossfunctional

Best Value Stream Mapping mac Software

 Wireless Networks
The Wireless Networks Solution extends ConceptDraw DIAGRAM software with professional diagramming tools, set of wireless network diagram templates and samples, comprehensive library of wireless communications and WLAN objects to help network engineers and designers efficiently design and create Wireless network diagrams that illustrate wireless networks of any speed and complexity, and help to identify all required equipment for construction and updating wireless networks, and calculating their costs.
- Cafe performance metrics vs. air temperature - Visual dashboard ...
- Sales metrics and KPIs - Visual dashboard | Website KPIs - Visual ...
- How To Create an HR Metric Dashboard | KPIs and Metrics | HR ...
- How To Create an HR Metric Dashboard | KPIs and Metrics ...
- Project — Working With Costs | Gantt charts for planning and ...
- How to Create a Release Burn-Down Chart Using ConceptDraw ...
- Project — Assigning Resources | Construction Project Chart ...
- Project — Working With Costs | How to Create Multiple Projects ...
- SWOT Matrix Template | How To Create an HR Metric Dashboard ...