Example of DFD for Online Store (Data Flow Diagram)


Sales Process Map

Basic Diagramming Flowchart Software

Functional Flow Block Diagram
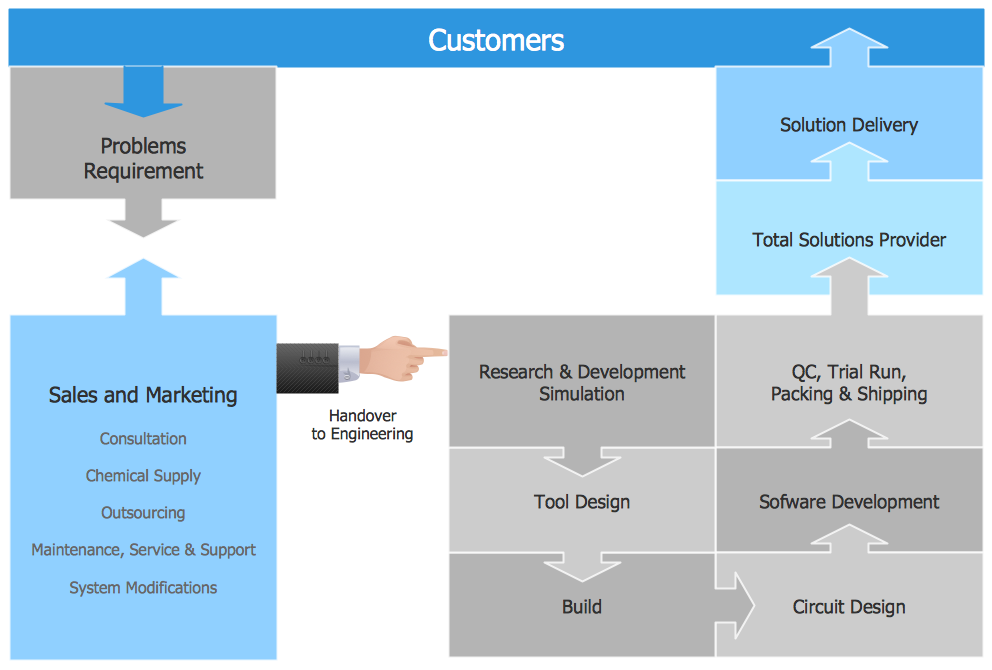
 Block Diagrams
Block diagrams solution extends ConceptDraw DIAGRAM software with templates, samples and libraries of vector stencils for drawing the block diagrams.
Use Case Diagrams technology with ConceptDraw DIAGRAM

Work Order Process Flowchart. Business Process Mapping Examples

 Rapid UML
Rapid UML solution extends ConceptDraw DIAGRAM software with templates, samples and libraries of vector stencils for quick drawing the UML diagrams using Rapid Draw technology.
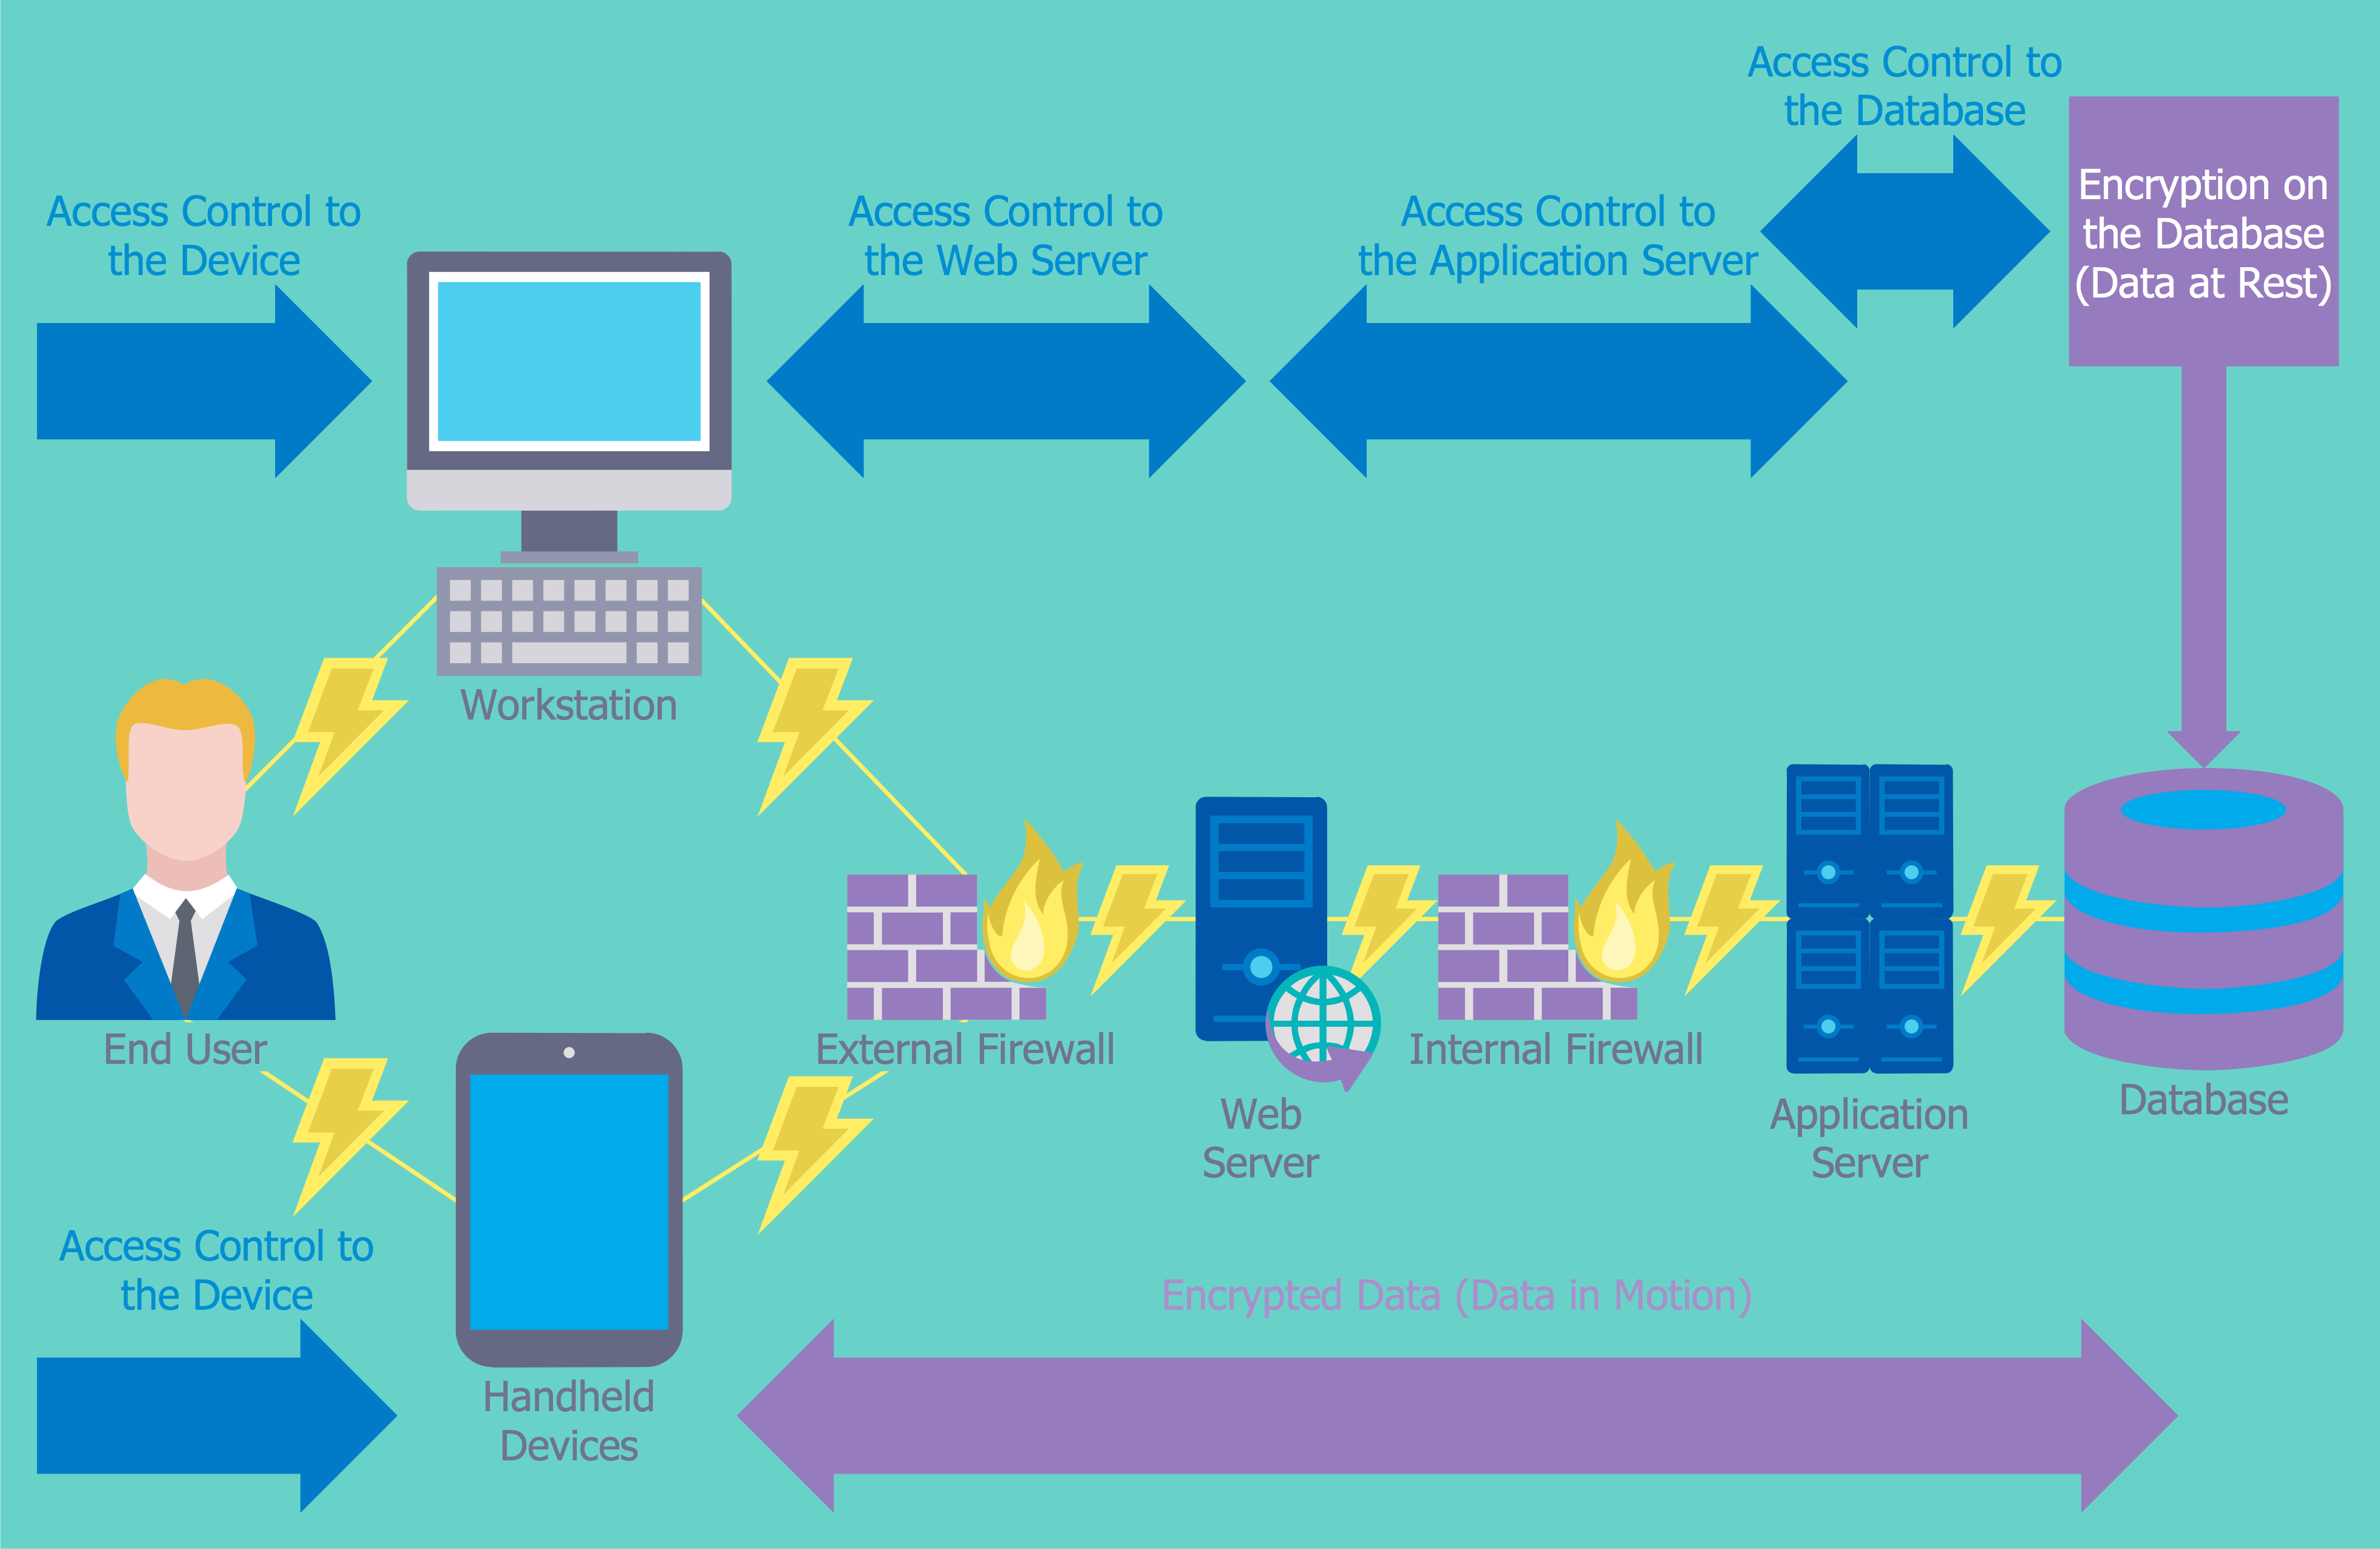
Network Security Devices
This SWOT matrix diagram example was created on the base of article "An Easy Way To Jumpstart Your Strategic Plan: SWOT" by Leslie Wolf from the website of the California Digital Library, the University of California. "Strategic planning doesn’t have to be a daunting and lengthy process. The goal is really a simple one: to help you understand your world and build a road map to guide your efforts. ...
This analysis tool can help you focus your attention on the specific success factors that are right for your team.
The tool is called a SWOT analysis. SWOT stands for Strengths and Weaknesses, Opportunities and Threats. Here’s what it means:
(1) Strengths are those positive internal attributes that strengthen your business or team. You can develop plans to capitalize on those strengths.
(2) Weaknesses are those negative internal attributes that are working against your success. You can shore up those weaknesses so they don’t stop your success.
(3) Opportunities are those external conditions that can have a positive effect on your goals. These opportunities can point you in the right direction.
(4) Threats are those external conditions that can have a negative effect on your goals. These threats will affect you less if you can identify and minimize them. ...
We thought it would be helpful to show you a sample SWOT analysis for a business you can easily visualize: a small independent bookstore in a university town. The store owner brought the team together to think about how the bookstore could survive during the continuing financial downturn. After an hour of brainstorming, this is the SWOT analysis they developed." [cdlib.org/ cdlinfo/ 2010/ 09/ 29/ an-easy-way-to-jumpstart-your-strategic-plan-swot/ ]
The matrix diagram example "SWOT analysis for a small independent bookstore" was created using the ConceptDraw PRO diagramming and vector drawing software extended with the SWOT Analysis solution from the Management area of ConceptDraw Solution Park.
SWOT matrix

 macOS User Interface
macOS User Interface solution extends the ConceptDraw DIAGRAM functionality with powerful GUI software graphic design features and tools. It provides an extensive range of multifarious macOS Sierra user interface design examples, samples and templates, and wide variety of libraries, containing a lot of pre-designed vector objects of Mac Apps icons, buttons, dialogs, menu bars, indicators, pointers, controls, toolbars, menus, and other elements for fast and simple designing high standard user interfaces of any complexity for new macOS Sierra.
 SWOT Analysis
SWOT and TOWS Matrix Diagrams solution extends ConceptDraw DIAGRAM and ConceptDraw MINDMAP software with features, templates, samples and libraries of vector stencils for drawing SWOT and TOWS analysis matrices and mind maps.
SWOT Analysis

- Basic Diagramming Flowchart Software | Functional Flow Block ...
- Personal Selling Process Diagram
- UML use case diagram - System of goods selling via catalogues ...
- Sales Process Flowchart. Flowchart Examples | UML use case ...
- Sales Process Flowchart. Flowchart Examples | UML use case ...
- Sales Process Flowchart. Flowchart Examples | Sales Dashboard ...
- Sales Process Flowchart Symbols | Sales flowchart - Vector stencils ...
- UML use case diagram - System of goods selling via catalogues ...
- Sales Process Flowchart. Flowchart Examples | Example of DFD for ...
- Sales Process Flowchart. Flowchart Examples | UML Use Case ...
- ATM UML Diagrams | UML use case diagram - System of goods ...
- UML use case diagram - System of goods selling via catalogues ...
- Process Flowchart | Marketing and Sales Organization chart ...
- Process Flowchart | UML Diagram | Computer and Networks Area ...
- Data Flow Diagram Symbols. DFD Library | Data Flow Diagram ...
- Sales Process Flowchart. Flowchart Examples | Competitor Analysis ...
- Cross Functional Flowchart Sales Process
- Sales Process Flowchart Symbols | SWOT Sample in Computers ...
- Mind Maps for Business - SWOT Analysis | The Sales Process ...
- Cross-Functional Flowchart | Business Process Flowchart Symbols ...