Process Flowchart


Work Order Process Flowchart. Business Process Mapping Examples

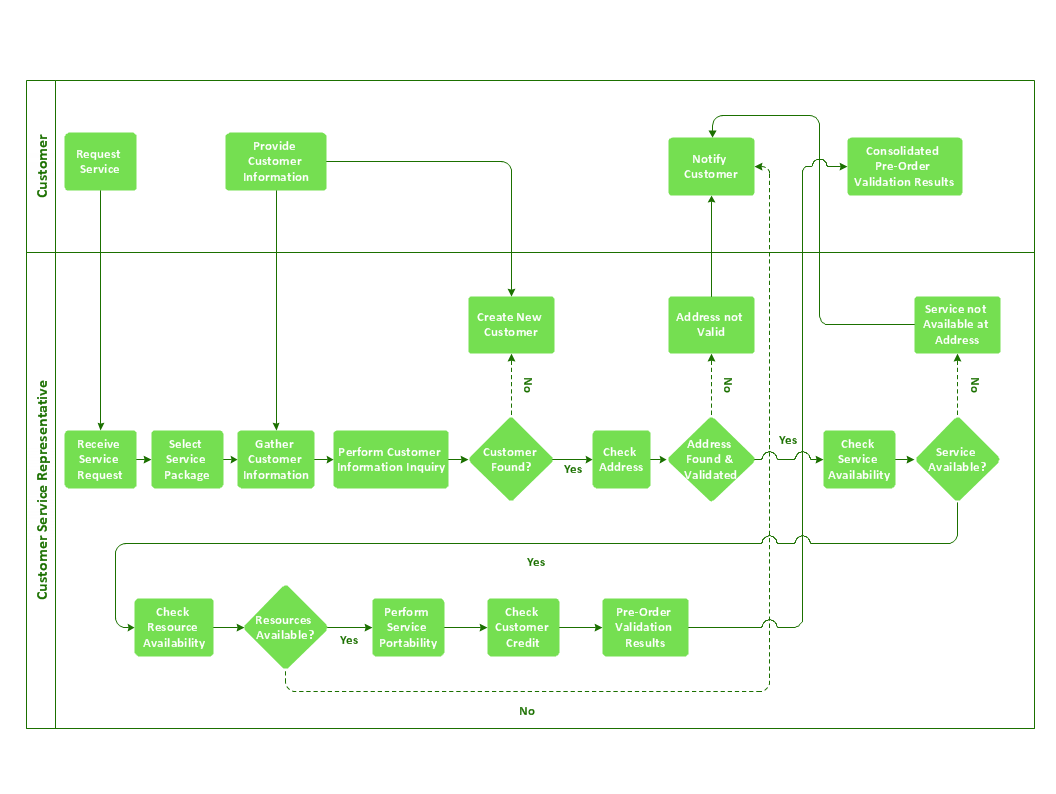
Cross-Functional Flowchart


 Value Stream Mapping
Value stream mapping solution extends ConceptDraw DIAGRAM software with templates, samples and vector stencils for drawing the Value Stream Maps (VSM) in lean manufacturing practice.
Types of Flowcharts


Business Process Flowchart
Competitor Analysis

Fishbone Diagram Example

Flowchart Symbols Accounting. Activity-based costing (ABC) flowchart

Total Quality Management Value

- Service Industry Process Flow Chart
- Process Flowchart | Copying Service Process Flowchart. Flowchart ...
- Service Process Mapping Project In Automobile Industry
- Fishbone Diagram Example For Service Industry
- Audit Flowcharts | Flowchart Of Service Industry
- Process Flowchart | Types of Flowchart - Overview | Financial Trade ...
- Process Flowchart | Taxi Service Data Flow Diagram DFD Example ...
- Cross Functional Flowchart for Business Process Mapping | Service ...
- Logistics Flow Charts | Business Process Mapping | Event-driven ...