Settlement Process Flowchart. Flowchart Examples

"Trade, also called goods exchange economy, is to transfer the ownership of goods from one person or entity to another by getting something in exchange from the buyer. Trade is sometimes loosely called commerce or financial transaction or barter. A network that allows trade is called a market. ...
Modern traders ... generally negotiate through a medium of exchange, such as money. As a result, buying can be separated from selling, or earning. ...
Retail trade consists of the sale of goods or merchandise from a very fixed location, such as a department store, boutique or kiosk, or by mail, in small or individual lots for direct consumption by the purchaser. Wholesale trade is defined as the sale of goods that are sold merchandise to retailers, to industrial, commercial, institutional, or other professional business users, or to other wholesalers and related subordinated services." [Trade. Wikipedia]
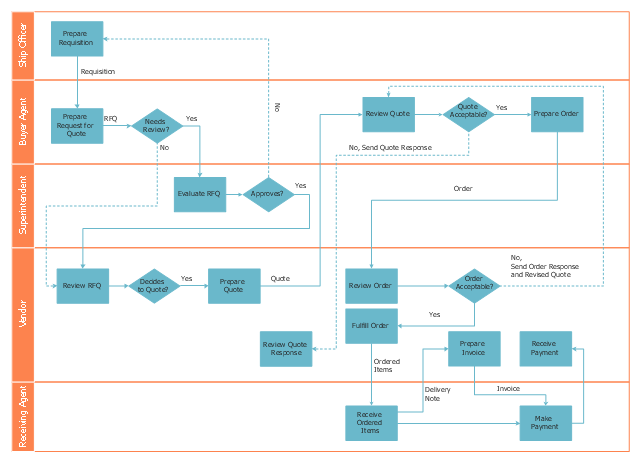
The deployment flow chart example "Trading process diagram" was created using the ConceptDraw PRO diagramming and vector drawing software extended with the Cross-Functional Flowcharts solution from the Business Processes area of ConceptDraw Solution Park.
Modern traders ... generally negotiate through a medium of exchange, such as money. As a result, buying can be separated from selling, or earning. ...
Retail trade consists of the sale of goods or merchandise from a very fixed location, such as a department store, boutique or kiosk, or by mail, in small or individual lots for direct consumption by the purchaser. Wholesale trade is defined as the sale of goods that are sold merchandise to retailers, to industrial, commercial, institutional, or other professional business users, or to other wholesalers and related subordinated services." [Trade. Wikipedia]
The deployment flow chart example "Trading process diagram" was created using the ConceptDraw PRO diagramming and vector drawing software extended with the Cross-Functional Flowcharts solution from the Business Processes area of ConceptDraw Solution Park.
Deployment flowchart
Target Diagram

Financial Trade UML Use Case Diagram Example

Business Mapping Software

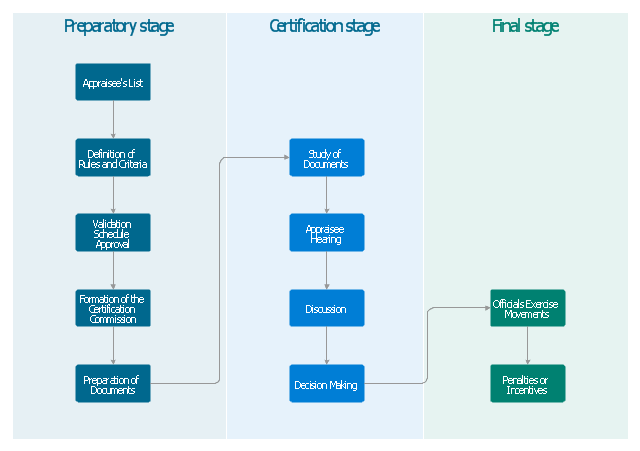
"Professional certification, trade certification, or professional designation, often called simply certification or qualification, is a designation earned by a person to assure qualification to perform a job or task. Not all certifications that use post-nominal letters are an acknowledgement of educational achievement, or an agency appointed to safeguard the public interest." [Professional certification. Wikipedia]
The vertical cross-functional flow chart example "Stages of personnel certification" was created using the ConceptDraw PRO diagramming and vector drawing software extended with the Flowcharts solution from the area "What is a Diagram" of ConceptDraw Solution Park.
The vertical cross-functional flow chart example "Stages of personnel certification" was created using the ConceptDraw PRO diagramming and vector drawing software extended with the Flowcharts solution from the area "What is a Diagram" of ConceptDraw Solution Park.
Cross-functional flowchart - Stages of personnel certification
 Target and Circular Diagrams
This solution extends ConceptDraw PRO software with samples, templates and library of design elements for drawing the Target and Circular Diagrams.
 Rapid UML
Rapid UML solution extends ConceptDraw PRO software with templates, samples and libraries of vector stencils for quick drawing the UML diagrams using Rapid Draw technology.
Use the Best FlowChart Tool for the Job

Program to Make Flow Chart

HelpDesk
How to Draw a Line Chart Quickly

- Cross -Functional Flowcharts in ConceptDraw | Trading process ...
- Trading process diagram - Deployment flowchart | Settlement ...
- Horizontal Flowchart | Cross -functional horizontal flowchart ...
- Deployment flowchart - Trading process diagram | Flowchart - Import ...
- Trading Bussiness Process Diagram
- Process Flow Of Trading
- Trading process diagram - Deployment flowchart | Cross -Functional ...
- Trading process diagram - Deployment flowchart | Cross -Functional ...
- Trading process diagram - Deployment flowchart | Trading process ...
- Deployment flowchart | Cross -Functional
- Trading process diagram - Deployment flowchart | Settlement ...
- Cross -Functional Flowcharts
- UML Deployment Diagram Example - ATM System UML diagrams ...
- Credit approval process - Cross -functional flowchart | Cross ...
- Cross -Functional Flowchart | Types of Flowcharts | Cross -Functional ...
- Financial Trade UML Use Case Diagram Example | Flow Chart ...
- Cross -Functional Flowcharts | UML Use Case Diagram Example ...
- Sales Process Flowchart. Flowchart Examples | UML Use Case ...
- Settlement Process Flowchart. Flowchart Examples | Trading ...
- Trading process diagram - Deployment flowchart | Financial Trade ...