This site uses cookies. By continuing to browse the ConceptDraw site you are agreeing to our Use of Site Cookies.

chemical engineering, process engineering, process flow diagram symbols, process and instrumentation diagram, process diagrams Chemical and Process Engineering

chemical engineering, process engineering, process flow diagram symbols, process and instrumentation diagram, process diagrams
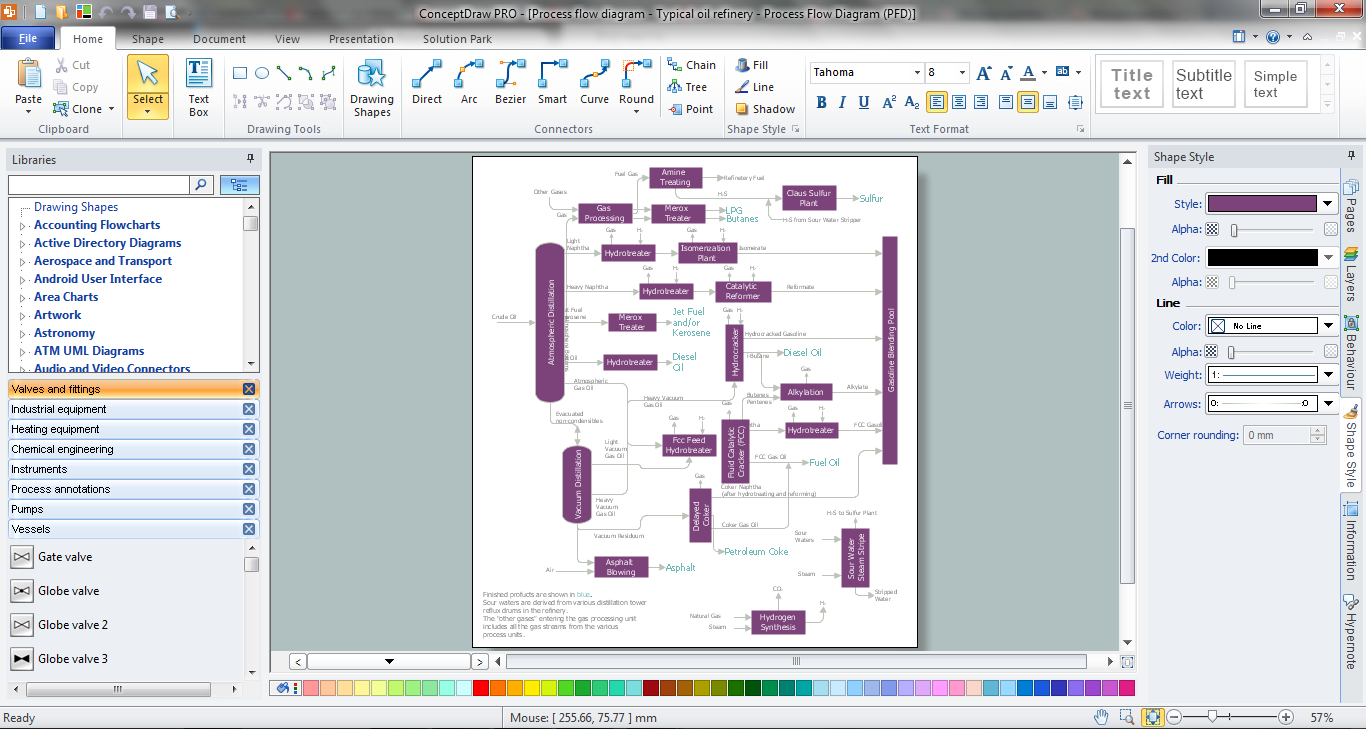
This chemical engineering solution extends ConceptDraw DIAGRAM.9.5 (or later) with process flow diagram symbols, samples, process diagrams templates and libraries of design elements for creating process and instrumentation diagrams, block flow diagrams (BFD

Chemical Engineering

ConceptDraw DIAGRAM is a powerful diagramming and vector drawing software. Extended with Chemical and Process Engineering Solution from the Industrial Engineering Area of ConceptDraw Solution Park, it became the best Chemical Engineering software.

Process Flow Diagram Symbols

Chemical and Process Engineering solution contains variety predesigned process flow diagram elements relating to instrumentation, containers, piping and distribution necessary for chemical engineering, and can be used to map out chemical processes or easy creating various Chemical and Process Flow Diagrams in ConceptDraw DIAGRAM.
HelpDesk

How to Draw a Process Flow Diagram

Process Flow diagrams are used in chemical and process engineering to show the flow of chemicals and the equipment involved in the process. When it comes to creating a process flow diagram, it's important to use software that is capable of describing a wide range of processes, using techniques and graphical notation that are easily recognized by engineering workers. An ideal drawing platform will utilize functions that can cope with the output of a high volume of engineering processes, that may change rapidly from development to implementation stages. ConceptDraw DIAGRAM, with the extended functionality of the Chemical and Process Engineering Diagrams solution, is the ideal medium for creating designs of this type. The Chemical and Process Engineering Diagrams solution complements this feature with a library of selected icons to represent various steps — all instantly recognizable and applicable to a wide user base. ConceptDraw DIAGRAM allows you to draw the Process Flow diagram easily using the set of special libraries.

Process Engineering

ConceptDraw DIAGRAM diagramming and vector drawing software supplied with Chemical and Process Engineering Solution from the Industrial Engineering Area of ConceptDraw Solution Park is powerful and effective process engineering software.

Process Flowchart

ConceptDraw is Professional business process mapping software for making process flow diagram, workflow diagram, general flowcharts and technical illustrations for business documents. It is includes rich examples, templates, process flowchart symbols. ConceptDraw flowchart maker allows you to easier create a process flowchart. Use a variety of drawing tools, smart connectors, flowchart symbols and shape libraries to create flowcharts of complex processes, process flow diagrams, procedures and information exchange.
How To Create a Process Flow Chart (business process modelling techniques)

Modelling Concepts for Business Engineering - EPC

Event-Driven Process chain Diagrams for improvement throughout an organisation.
ConceptDraw DIAGRAM - software that reduces the time needed to create a business process model.

Program Evaluation and Review Technique (PERT) with ConceptDraw DIAGRAM

PERT Diagram is a more realistic approach of a project's time estimate analysis. After PERT chart was constructed user can discover the shortest possible duration for entire project timescale. The project timeline is the longest chain that might be taken with connected tasks on the PERT Diagram. Completion of serial tasks need to be accomplished in a presented order. At a project timeline can be independent tasks that not linked with main sequence they are called parallel tasks. PERT diagram is more suitable for Critical Path Analysis than Gantt chart for the reason that it undoubtedly better determine task dependencies. Project managers customarily utilize both methodologies.

fault tree analysis, fishbone diagram, cause and effect diagrams, fault tree analysis software, fault tree analysis example Fault Tree Analysis Diagrams

fault tree analysis, fishbone diagram, cause and effect diagrams, fault tree analysis software, fault tree analysis example
This solution extends ConceptDraw DIAGRAM.5 or later with templates, fault tree analysis example, samples and a library of vector design elements for drawing FTA diagrams (or negative analytical trees), cause and effect diagrams and fault tree diagrams.

chemical drawings, chemistry equation symbols, chemical drawing software Chemistry

chemical drawings, chemistry equation symbols, chemical drawing software
This solution extends ConceptDraw DIAGRAM software with samples, template and libraries of vector stencils for drawing the Chemistry Illustrations for science and education.