Flowchart Definition

 Flowcharts
The Flowcharts solution for ConceptDraw DIAGRAM is a comprehensive set of examples and samples in several varied color themes for professionals that need to represent graphically a process. Solution value is added by the basic flow chart template and shapes' libraries of flowchart notation. ConceptDraw DIAGRAM flow chart creator lets one depict the processes of any complexity and length, as well as design the Flowchart either vertically or horizontally.
Flowchart Software


 Logistics Flow Charts
Logistics Flow Charts solution extends ConceptDraw DIAGRAM functionality with opportunities of powerful logistics management software. It provides large collection of predesigned vector logistic symbols, pictograms, objects and clipart to help you design with pleasure Logistics flow chart, Logistics process flow diagram, Inventory flow chart, Warehouse flowchart, Warehouse management flow chart, Inventory control flowchart, or any other Logistics diagram. Use this solution for logistics planning, to reflect logistics activities and processes of an enterprise or firm, to depict the company's supply chains, to demonstrate the ways of enhancing the economic stability on the market, to realize logistics reforms and effective products' promotion.
Functional Flow Block Diagram

Stakeholder Management System

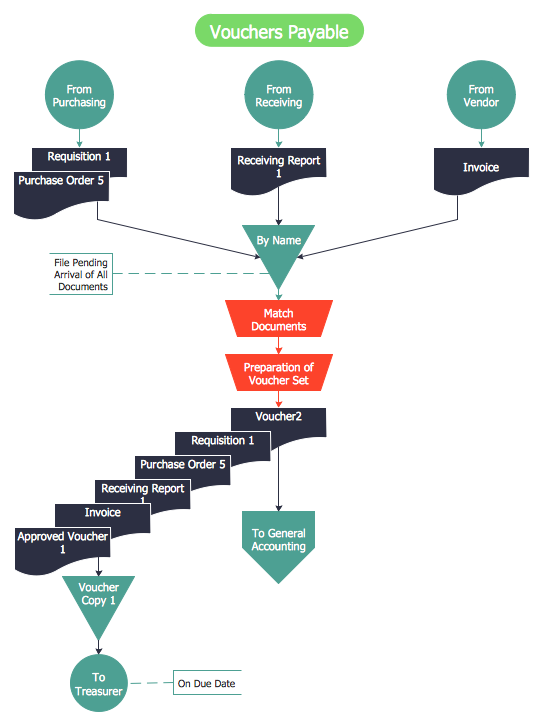
Accounts Payable Flowchart
Venn Diagram Examples for Problem Solving. Computer Science. Chomsky Hierarchy

Systems Engineering
Seven Basic Tools of Quality — Quality Control

- Logistics Flow Charts | Flow Chart Techniques Principle Of Flowchart
- Flow Chart Technique Principle Of Flow Charting
- A Wellstructured Diagram With Flowing Work Activities
- Logistics Flow Charts | Cloud Computing Diagrams | Pyramid ...
- Process Flowchart | How to Create Flowcharts for an Accounting ...
- Logistics Flow Charts | Diagram Of Structure Flow Chart For ...
- Flowchart Environmental Factors
- Types of Flowcharts | Basic Flowchart Symbols and Meaning ...
- Path to sustainable development | How to Draw Business Process ...
- Euclidean algorithm - Flowchart | Basic Flowchart Symbols and ...