Total Quality Management Definition
The Total Quality Management Diagram solution helps you and your organization visualize business and industrial processes. Create Total Quality Management diagrams for business process with ConceptDraw software.How to Use the Export To PowerPoint Function in Your Mindmap Tool
There’s no shortage of ways the new Microsoft® PowerPoint® import capability in ConceptDraw MINDMAP can help you.TQM Software — Build Professional TQM Diagrams
The Total Quality Management Diagram solution helps you and your organization visualize business and industrial processes. Create Total Quality Management diagrams for business process with ConceptDraw software.How to Create Presentation of Your Project Gantt Chart
During the planning, discussing and execution of a project you may need to prepare a presentation using project views such as the Gantt Chart, Multiproject Dashboard or Resource Usage View. It’s easy do with ConceptDraw PROJECT!Value Stream Mapping Presentations
Users can create Value Stream Mapping Presentations using presentation mode in ConceptDraw DIAGRAM.How to Deliver Presentations using Mind Maps
Creating and organizing presentations, structuring received presentations, presenting mind maps, and preparing for public presenting.Creating a default presentation in ConceptDraw MINDMAP
ConceptDraw MINDMAP a versatile, yet easy-to-use tool for organizing ideas and data. Creates mind maps that intuitively illustrate your thought process. Outputs a wide variety of document styles and formats. Delivers presentations from mind maps with built-in modes and MS PowerPoint export. Perfect for brainstorming, project planning, meeting management, note taking, and more.Best Mind Mapping Program for Making Presentations
ConceptDraw MINDMAP with the ability to import presentations from Microsoft PowerPoint, as well as enhancing its existing presentation capabilities.Project Management
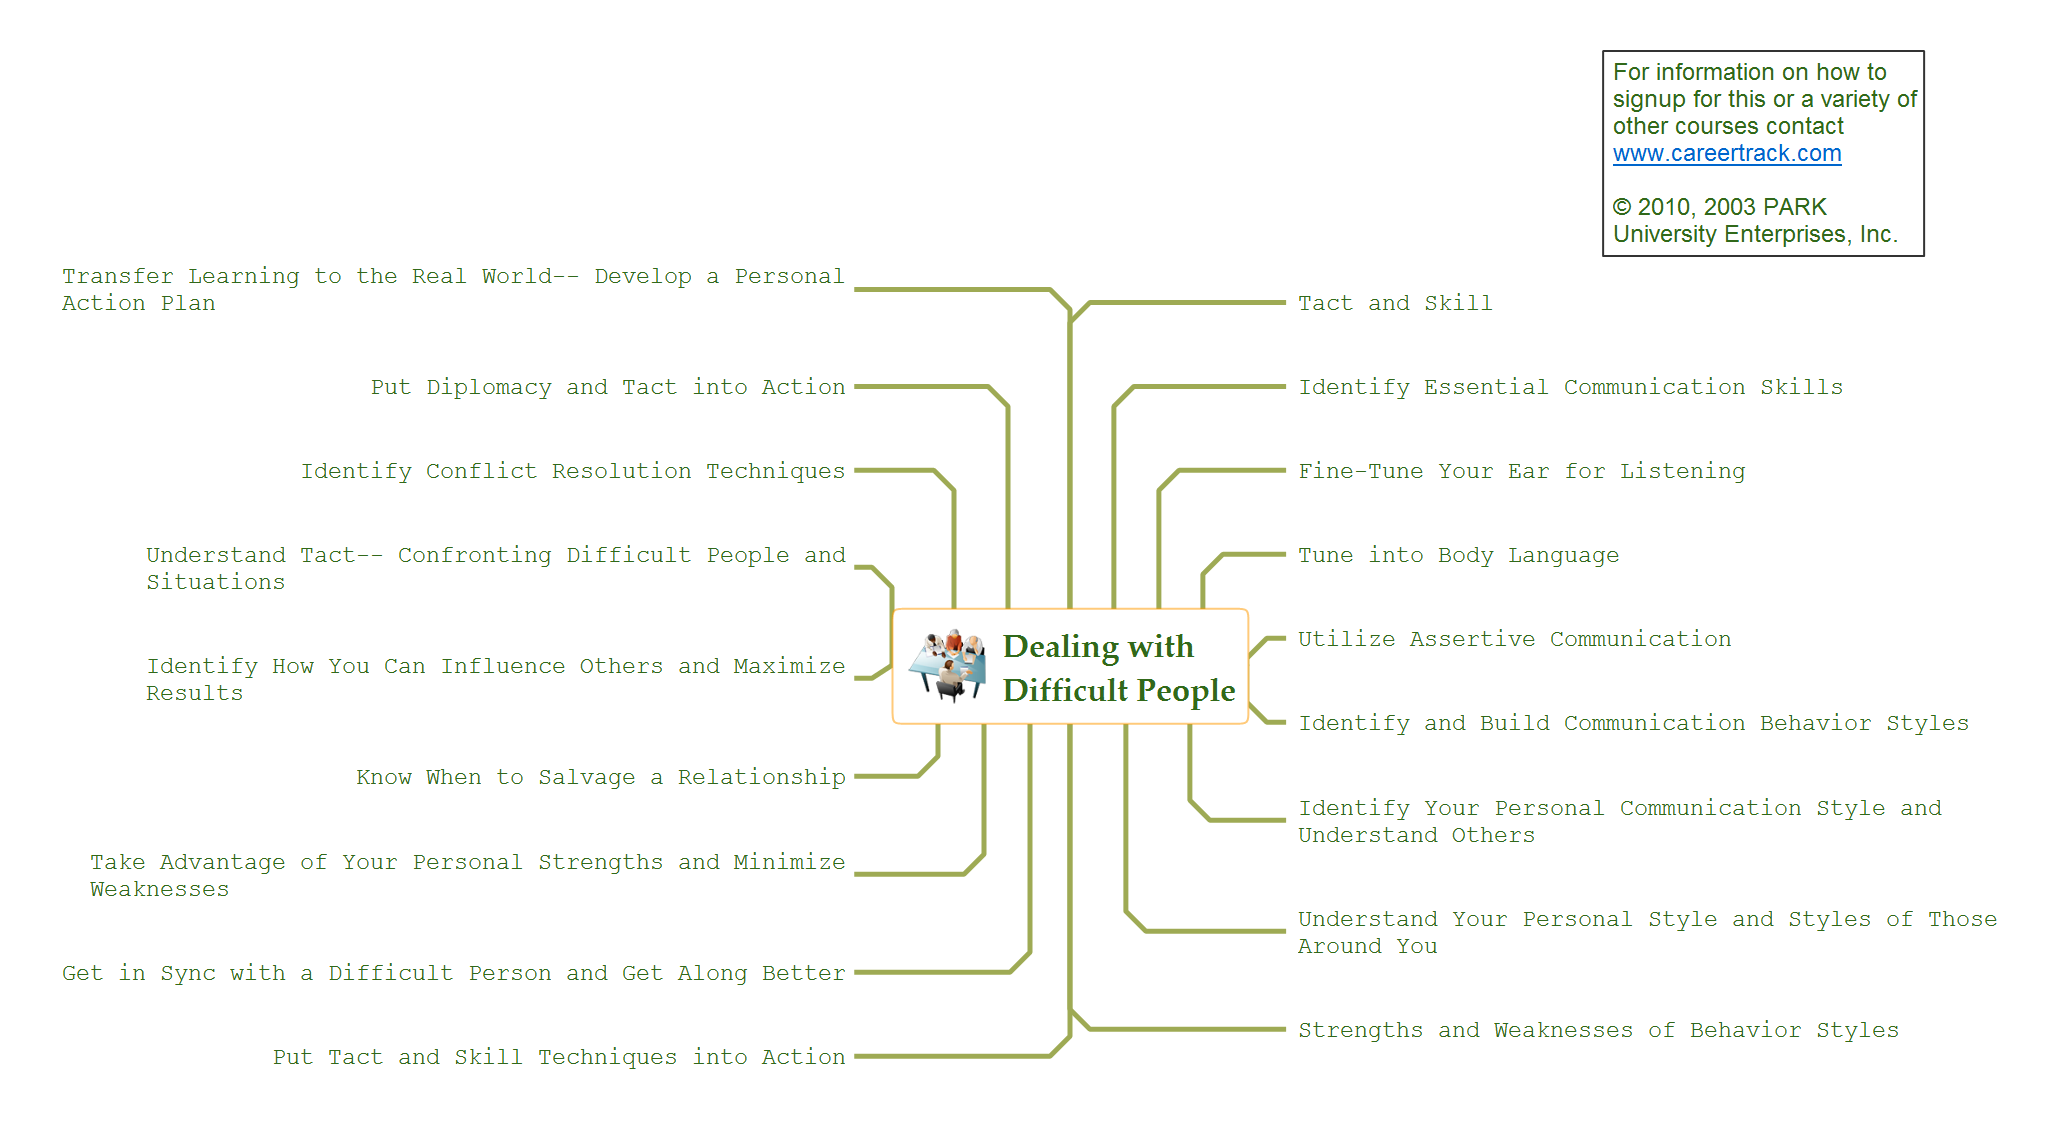
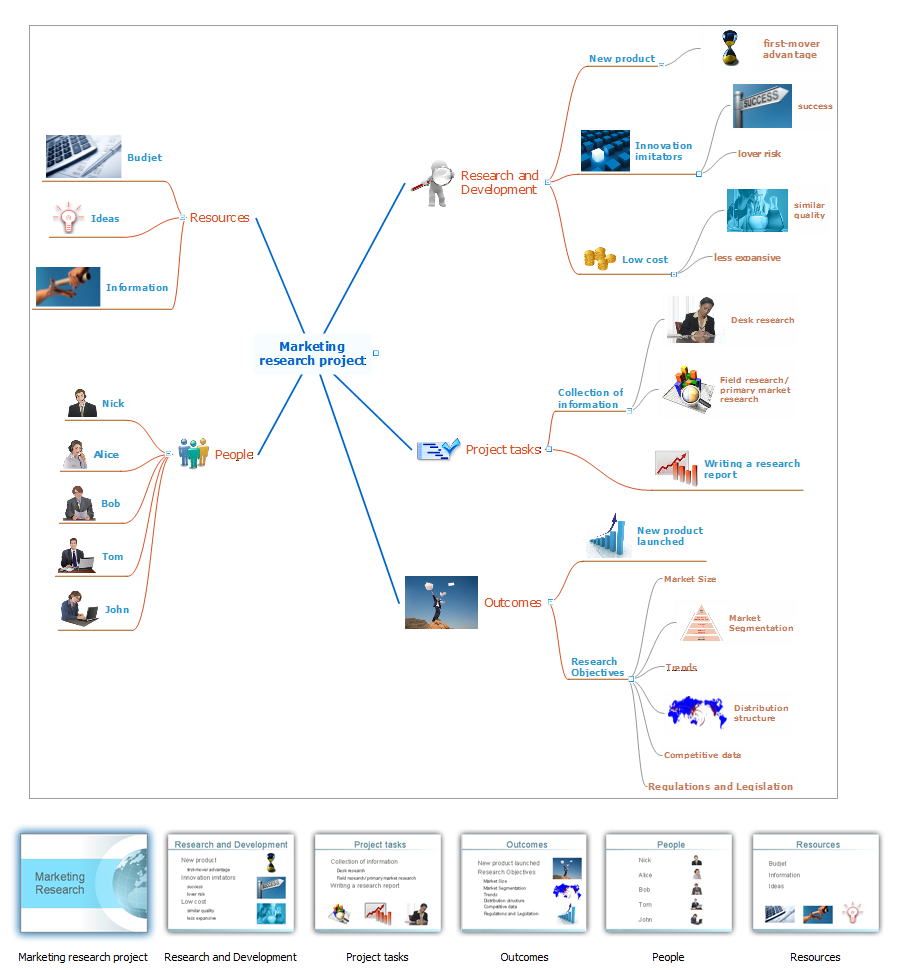
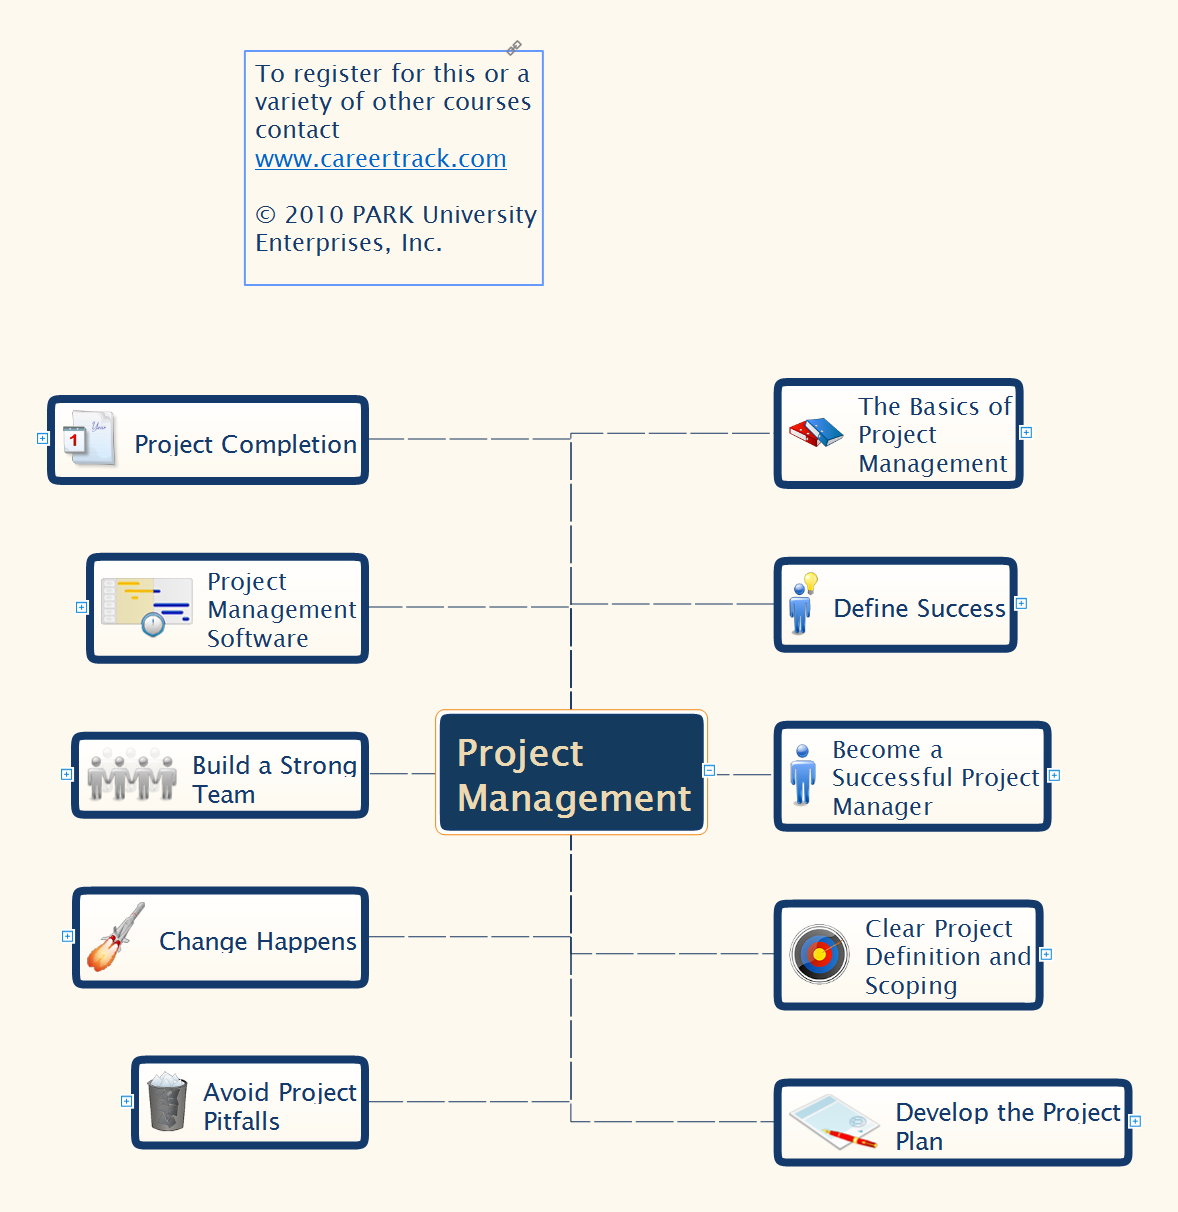
Mind Maps is a visual tool that helps to structure, understand and analyze the information, to find new ideas and solutions to problems. They find their application in many areas of life due to the fact that are convenient graphical way of presenting information. The project management is one of the most popular applications of Mind Maps, which give you the opportunity to make your project plan, to navigate easier in the project and manage it visually, to systematize knowledge, to get a clear picture of what is happening in the project, to save time and quickly find the right solutions and possible defects. Mind Maps ideally suit as a way to make notes during the meetings, presentations, conferences, to record ideas generated during a brainstorming. ConceptDraw MINDMAP software is effective for using in project management. It offers the tools for brainstorming and Mind Maps construction, helps project managers to visually represent the whole project, its implementation phases, to track the current state and switch between the different levels of detailing, showing or hiding some branches. ConcepDraw MINDMAP lets the possibility to make the report or presentation from your Mind Map and provides the compatibility with ConceptDraw Project and MS Project.ConceptDraw DIAGRAM Comparison with Omnigraffle Professional and MS Visio
ConceptDraw DIAGRAM comparison with Omnigraffle Professional and MS Visio shows you the significant benefits of ConceptDraw DIAGRAM , which offers varied useful drawing tools, the capability of creation multi-page documents, wide export / import capabilities in graphics formats, integration with Visio and Microsoft Office applications, availability of built-in scripting language and ConceptDraw Solution Park with numerous solutions, vector objects libraries, templates and samples. Business today is conducted with incredible rate and dynamic presentations become very popular. Sometimes while conducting the business, may happen that you can't describe some situation, state, or process with only words. In these cases, it is convenient to include graphics and diagrams associated with the text. This guarantees successful communication with other stakeholders and team members, and faultless understanding the information by them. The combination of words and graphics is an ideal combination, it improves the clarity and removes any doubt. ConceptDraw DIAGRAM helps you easily create any kinds of diagrams and dynamic presentations too.- Swot Analysis Definition Ppt
- Percentage Bar Diagram Definition
- Quality Control Flowchart Ppt
- How to Add a Block Diagram to a PowerPoint Presentation Using ...
- Network Glossary Definition | Personal area (PAN) networks ...
- Process Flowchart | TQM Software — Build Professional TQM ...
- Project Charts And Layouts Ppt
- Swot Ppt
- Subdivided Bar Diagram Examples With Daigram
- Wireless Networks | Wireless Metropolitan Area Network Ppt