The vector stencils library "Professions" contains 58 people clipart images of different professions you can use in your presentations, illustrations and infographics.
"Electronic clip art is available in several different file formats. It is important for clip art users to understand the differences between file formats so that they can use an appropriate image file and get the resolution and detail results they need.
Clip art file formats are divided into 2 different types: bitmap or vector graphics. ...
In contrast to the grid format of bitmap images, Vector graphics file formats use geometric modeling to describe an image as a series of points, lines, curves, and polygons. Because the image is described using geometric data instead of fixed pixels, the image can be scaled to any size while retaining "resolution independence", meaning that the image can be printed at the highest resolution a printer supports, resulting in a clear, crisp image. Vector file formats are usually superior in resolution and ease of editing as compared to bitmap file formats, but are not as widely supported by software and are not well-suited for storing pixel-specific data such as scanned photographs. In the early years of electronic clip art, vector illustrations were limited to simple line art representations." [Clip art. Wikipedia]
The clip art example "Professions - Vector stencils library" was created using the ConceptDraw PRO diagramming and vector drawing software extended with the People solution from the Illustration area of ConceptDraw Solution Park.
www.conceptdraw.com/ solution-park/ illustrations-people
Builder 1

System administrator

Worker of conveyor

Clerk 1

Clerk 2

Student 2

Student 3

Student 1

Dispatcher 1

Accountant

Gardener

Lawyer

Jurist

Judge

Consultant

Manager

Director

Programmer

Architect

Pilot

Policeman

Secretary

Security officer

Clerk 3

Musician

Presenter

Athlete

Artist

Announcer

Photographer

Hairdresser

Florist

Spaceman

Engineer

Reporter

Tailor

Dispatcher 2

Biologist

Chemist

Dentist

Priest

Soldier

Doctor

Driver

Carpenter

Fireman

Seaman

Builder 2

Postman

Miner

Waiter

Cleaner

Cashier

Shop assistant

Cook

Flight attendant

Teacher

Hall porter

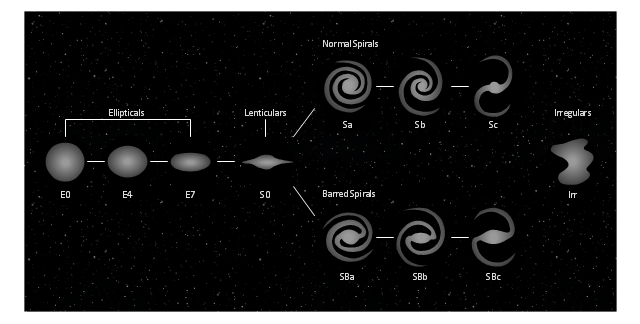
This tuning-fork style diagram of the Hubble sequence was created on the base of the Wikimedia Commons file: Hubble sequence photo.png. [commons.wikimedia.org/ wiki/ File:Hubble_ sequence_ photo.png]
"The Hubble sequence is a morphological classification scheme for galaxies invented by Edwin Hubble in 1936. It is often known colloquially as the Hubble tuning fork diagram because of the shape in which it is traditionally represented.
Hubble’s scheme divides regular galaxies into 3 broad classes - ellipticals, lenticulars and spirals - based on their visual appearance (originally on photographic plates). A fourth class contains galaxies with an irregular appearance. To this day, the Hubble sequence is the most commonly used system for classifying galaxies, both in professional astronomical research and in amateur astronomy." [Hubble sequence. Wikipedia]
The astronomical diagram example "Tuning-fork style diagram of the Hubble sequence" was created using the ConceptDraw PRO diagramming and vector drawing software extended with the Astronomy solution from the Science and Education area of ConceptDraw Solution Park.
Morphological classification scheme for galaxies
This process flow diagram (PFD) of a typical crude oil distillation unit as used in petroleum crude oil refineries was redrawn from Wikipedia file: Crude Oil Distillation Unit.png. [en.wikipedia.org/ wiki/ File:Crude_ Oil_ Distillation_ Unit.png]
This file is licensed under the Creative Commons Attribution-Share Alike 3.0 Unported license. [creativecommons.org/ licenses/ by-sa/ 3.0/ deed.en]
"An oil refinery or petroleum refinery is an industrial process plant where crude oil is processed and refined into more useful products such as petroleum naphtha, gasoline, diesel fuel, asphalt base, heating oil, kerosene and liquefied petroleum gas. Oil refineries are typically large, sprawling industrial complexes with extensive piping running throughout, carrying streams of fluids between large chemical processing units. In many ways, oil refineries use much of the technology of, and can be thought of, as types of chemical plants. The crude oil feedstock has typically been processed by an oil production plant. There is usually an oil depot (tank farm) at or near an oil refinery for the storage of incoming crude oil feedstock as well as bulk liquid products.
An oil refinery is considered an essential part of the midstream side of the petroleum industry." [en.wikipedia.org/ wiki/ Oil_ refinery]
The process flow diagram (PFD) example "Crude oil distillation" was drawn using the ConceptDraw PRO diagramming and vector drawing software extended with the Chemical and Process Engineering solution from the Chemical and Process Engineering area of ConceptDraw Solution Park.
Process flow diagram (PFD)
-crude-oil-distillation-unit---pfd.png--diagram-flowchart-example.png)
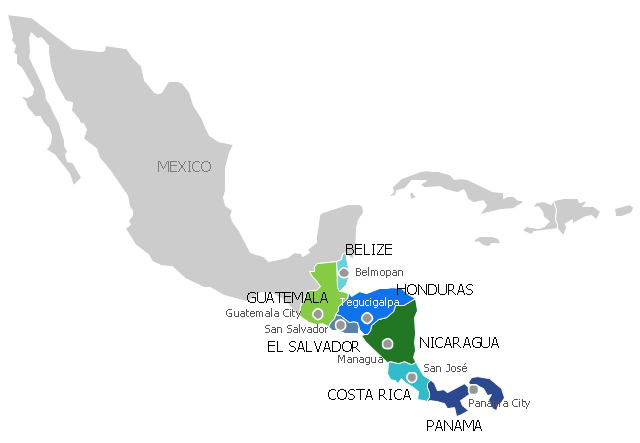
"Central America ... is the central geographic region of the Americas. It is the southernmost, isthmian portion of the North American continent, which connects with South America on the southeast. When considered part of the unified continental model, it is considered a subcontinent. Central America consists of seven countries: Belize, Costa Rica, El Salvador, Guatemala, Honduras, Nicaragua, and Panama. Central America is part of the Mesoamerican biodiversity hotspot, which extends from northern Guatemala through central Panama. It is bordered by Mexico to the north, the Caribbean Sea to the east, the North Pacific Ocean to the west, and Colombia to the south-east, which is also the most southern point of North America." [Central America. Wikipedia]
This example Political map of Central America was redesigned from Wikimedia Commons file: Map of Central America.png. [commons.wikimedia.org/ wiki/ File:Map_ of_ Central_ America.png]
This file is licensed under the Creative Commons Attribution-Share Alike 3.0 Unported license. [creativecommons.org/ licenses/ by-sa/ 3.0/ deed.en]
The example "Political map of Central America" was created using the ConceptDraw PRO diagramming and vector drawing software extended with the Continent Maps solution from the Maps area of ConceptDraw Solution Park.
Political map - Central America
This PFD sample was redesigned from the Wikipedia file: NaturalGasCondensate.png.
"This is a schematic flow diagram of a typical facility for separating and recovering liquid condensate from raw natural gas."
[en.wikipedia.org/ wiki/ File:NaturalGasCondensate.png]
"Natural-gas condensate is a low-density mixture of hydrocarbon liquids that are present as gaseous components in the raw natural gas produced from many natural gas fields. It condenses out of the raw gas if the temperature is reduced to below the hydrocarbon dew point temperature of the raw gas.
The natural gas condensate is also referred to as simply condensate, or gas condensate, or sometimes natural gasoline because it contains hydrocarbons within the gasoline boiling range. Raw natural gas may come from any one of three types of gas wells:
(1) Crude oil wells - Raw natural gas that comes from crude oil wells is called associated gas. This gas can exist separate from the crude oil in the underground formation, or dissolved in the crude oil.
(2) Dry gas wells - These wells typically produce only raw natural gas that does not contain any hydrocarbon liquids. Such gas is called non-associated gas.
(3) Condensate wells - These wells produce raw natural gas along with natural gas liquid. Such gas is also non-associated gas and often referred to as wet gas." [Natural-gas condensate. Wikipedia]
The process flow diagram example "Natural gas condensate - PFD" was drawn using the ConceptDraw PRO software extended with the Chemical and Process Engineering solution from the Chemical and Process Engineering area of ConceptDraw Solution Park.
Process flow diagram (PFD)
-natural-gas-condensate---pfd.png--diagram-flowchart-example.png)
This is a schematic process flow diagram of the processes used in a typical oil refinery.
This process flow diagram (PFD) example was redesigned from the Wikimedia Commons file: RefineryFlow.png. [commons.wikimedia.org/ wiki/ File:RefineryFlow.png]
This file is licensed under the Creative Commons Attribution-Share Alike 3.0 Unported license. [creativecommons.org/ licenses/ by-sa/ 3.0/ deed.en]
"An oil refinery or petroleum refinery is an industrial process plant where crude oil is processed and refined into more useful products such as petroleum naphtha, gasoline, diesel fuel, asphalt base, heating oil, kerosene and liquefied petroleum gas. Oil refineries are typically large, sprawling industrial complexes with extensive piping running throughout, carrying streams of fluids between large chemical processing units. In many ways, oil refineries use much of the technology of, and can be thought of, as types of chemical plants. The crude oil feedstock has typically been processed by an oil production plant. There is usually an oil depot (tank farm) at or near an oil refinery for the storage of incoming crude oil feedstock as well as bulk liquid products.
An oil refinery is considered an essential part of the downstream side of the petroleum industry." [Oil refinery. Wikipedia]
The PFD example "Process flow diagram - Typical oil refinery" was created using the ConceptDraw PRO diagramming and vector drawing software extended with the Chemical and Process Engineering solution from the Chemical and Process Engineering area of ConceptDraw Solution Park.
Process Flow Diagram (PFD)
-process-flow-diagram---typical-oil-refinery.png--diagram-flowchart-example.png)
This cycle process chart was redesigned from the Wikimedia Commons file: Business Feedback Loop PNG version.png.
"A business ideally is continually seeking feedback from customers: are the products helpful? are their needs being met? Constructive criticism helps marketers adjust offerings to meet customer needs."
[commons.wikimedia.org/ wiki/ File:Business_ Feedback_ Loop_ PNG_ version.png]
The cycle process diagram example "Business feedback loop" was created using the ConceptDraw PRO diagramming and vector drawing software extended with the Sales Flowcharts solution from the Marketing area of ConceptDraw Solution Park.
Customers feedback cycle process chart

A five level pyramid model of different types of Information Systems based on the information processing requirement of different levels in the organization. The first level represents transaction processing systems to process basic data. The second level represents office support systems to process information in office. The third level represents management information systems to process information by managers. The fourth level represents decision support systems to process explicit knowledge. The fifth level represents executive information systems to process tacit knowledge.
"A Computer(-Based) Information System is essentially an IS using computer technology to carry out some or all of its planned tasks. The basic components of computer based information system are:
(1) Hardware - these are the devices like the monitor, processor, printer and keyboard, all of which work together to accept, process, show data and information.
(2) Software - are the programs that allow the hardware to process the data.
(3) Databases - are the gathering of associated files or tables containing related data.
(4) Networks - are a connecting system that allows diverse computers to distribute resources.
(5) Procedures - are the commands for combining the components above to process information and produce the preferred output.
The first four components (hardware, software, database and network) make up what is known as the information technology platform. Information technology workers could then use these components to create information systems that watch over safety measures, risk and the management of data. These actions are known as information technology services." [Information systems. Wikipedia]
This pyramid diagram was redesigned using the ConceptDraw PRO diagramming and vector drawing software from Wikimedia Commons file Five-Level-Pyramid-model.png. [commons.wikimedia.org/ wiki/ File:Five-Level-Pyramid-model.png]
This file is licensed under the Creative Commons Attribution 3.0 Unported license. [creativecommons.org/ licenses/ by/ 3.0/ deed.en]
The triangle chart example "Information systems types" is included in the Pyramid Diagrams solution from the Marketing area of ConceptDraw Solution Park.
Pyramid diagram

This circle diagram sample was redesigned from the Wikimedia Commons file: Research cycle.png. "Some of the basic elements of the scientific method, arranged in a cycle to emphasize that it is an iterative process." [commons.wikimedia.org/ wiki/ File:Research_ cycle.png]
This file is licensed under the Creative Commons Attribution 2.0 Generic license. [creativecommons.org/ licenses/ by/ 2.0/ deed.en]
"The scientific method is a body of techniques for investigating phenomena, acquiring new knowledge, or correcting and integrating previous knowledge. To be termed scientific, a method of inquiry must be based on empirical and measurable evidence subject to specific principles of reasoning. ...
Four essential elements of the scientific method are iterations, recursions, interleavings, or orderings of the following:
(1) Characterizations (observations, definitions, and measurements of the subject of inquiry).
(2) Hypotheses (theoretical, hypothetical explanations of observations and measurements of the subject).
(3) Predictions (reasoning including logical deduction from the hypothesis or theory).
(4) Experiments (tests of all of the above)...
A linearized, pragmatic scheme of the four points above is sometimes offered as a guideline for proceeding:
(1) Define a question.
(2) Gather information and resources (observe).
(3) Form an explanatory hypothesis.
(4) Test the hypothesis by performing an experiment and collecting data in a reproducible manner.
(5) Analyze the data.
(6) Interpret the data and draw conclusions that serve as a starting point for new hypothesis.
(7) Publish results.
(8) Retest (frequently done by other scientists).
The iterative cycle inherent in this step-by-step method goes from point 3 to 6 back to 3 again." [Scientific method. Wikipedia]
The circle diagram example "Research cycle" was created using the ConceptDraw PRO diagramming and vector drawing software extended with the Target and Circular Diagrams solution from the Marketing area of ConceptDraw Solution Park.
www.conceptdraw.com/ solution-park/ marketing-target-and-circular-diagrams
Circle diagram

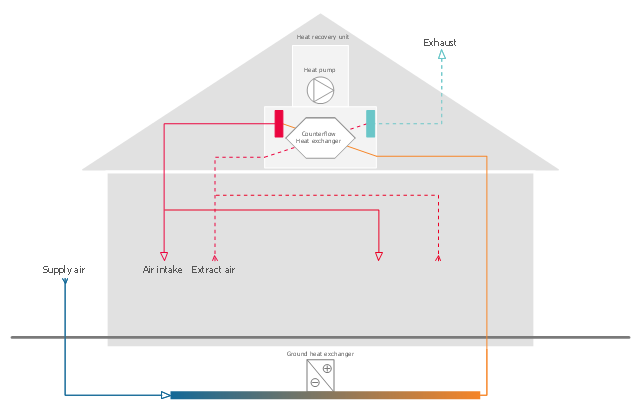
This HVAC plan example was redesigned from the Wikimedia Commons file: Ventilation unit with heat pump & ground heat exchanger.png. [commons.wikimedia.org/ wiki/ File:Ventilation_ unit_ with_ heat_ pump_ %26_ ground_ heat_ exchanger.png]
This file is licensed under the Creative Commons Attribution-Share Alike 3.0 Unported license. [creativecommons.org/ licenses/ by-sa/ 3.0/ deed.en]
"Heat recovery ventilation, also known as HRV, mechanical ventilation heat recovery, or MVHR, is an energy recovery ventilation system using equipment known as a heat recovery ventilator, heat exchanger, air exchanger, or air-to-air heat exchanger which employs a counter-flow heat exchanger (countercurrent heat exchange) between the inbound and outbound air flow. HRV provides fresh air and improved climate control, while also saving energy by reducing heating (and cooling) requirements.
Energy recovery ventilators (ERVs) are closely related, however ERVs also transfer the humidity level of the exhaust air to the intake air." [Heat recovery ventilation. Wikipedia]
The HVAC plan example "Ventilation unit with heat pump and ground heat exchanger" was created using the ConceptDraw PRO diagramming and vector drawing software extended with the HVAC Plans solution from the Building Plans area of ConceptDraw Solution Park.
HVAC plan
The 3D Column chart example "Iran internet users per 100 person" was redesigned from the Commons Wikimedia file: Iran internet users per 100 person.png.
[commons.wikimedia.org/ wiki/ File:Iran_ internet_ users_ per_ 100_ person.png]
This file is licensed under the Creative Commons Attribution-Share Alike 3.0 Unported license. [creativecommons.org/ licenses/ by-sa/ 3.0/ deed.en]
The data source is World Bank: [data.worldbank.org/ country/ iran-islamic-republic]
"In 1993 Iran became the second country in the Middle East to be connected to the Internet, and since then the government has made significant efforts to improve the nation's ICT infrastructure. Iran's national Internet connectivity infrastructure is based on two major networks: the public switched telephone network (PSTN) and the public data network. The PSTN provides a connection for end-users to Internet service providers (ISPs) over mostly digital lines and supports modem-based connections. The Data Communication Company of Iran (DCI), a subsidiary of TCI, operates the public data network." [Internet in Iran. Wikipedia]
The 3D Column chart example "Iran internet users per 100 person" was created using the ConceptDraw PRO diagramming and vector drawing software extended with the Bar Graphs solution from the Graphs and Charts area of ConceptDraw Solution Park.
www.conceptdraw.com/ solution-park/ charts-bar-graphs
3D Column chart

This PFD of jet fuel mercaptan oxidation treating was redrawn from Wikipedia file: ConvLPGMerox.png. [en.wikipedia.org/ wiki/ File:ConvKeroMerox.png]
This file is licensed under the Creative Commons Attribution-Share Alike 3.0 Unported icense. [creativecommons.org/ licenses/ by-sa/ 3.0/ deed.en]
"Merox is an acronym for mercaptan oxidation. It is a proprietary catalytic chemical process developed by UOP used in oil refineries and natural gas processing plants to remove mercaptans from LPG, propane, butanes, light naphthas, kerosene and jet fuel by converting them to liquid hydrocarbon disulfides.
The Merox process requires an alkaline environment which, in some of the process versions, is provided by an aqueous solution of sodium hydroxide (NaOH), a strong base, commonly referred to as caustic. In other versions of the process, the alkalinity is provided by ammonia, which is a weak base.
The catalyst in some versions of the process is a water-soluble liquid. In other versions, the catalyst is impregnated onto charcoal granules.
Processes within oil refineries or natural gas processing plants that remove mercaptans and/ or hydrogen sulfide (H2S) are commonly referred to as sweetening processes because they results in products which no longer have the sour, foul odors of mercaptans and hydrogen sulfide. The liquid hydrocarbon disulfides may remain in the sweetened products, they may be used as part of the refinery or natural gas processing plant fuel, or they may be processed further.
The Merox process is usually more economical than using a catalytic hydrodesulfurization process for much the same purpose." [en.wikipedia.org/ wiki/ Merox]
The process flow diagram (PFD) example "Jet fuel mercaptan oxidation treating" was drawn using the ConceptDraw PRO software extended with the Chemical and Process Engineering solution from the Chemical and Process Engineering area of ConceptDraw Solution Park.
Process flow diagram (PFD)
-jet-fuel-mercaptan-oxidation-treating---pfd.png--diagram-flowchart-example.png)
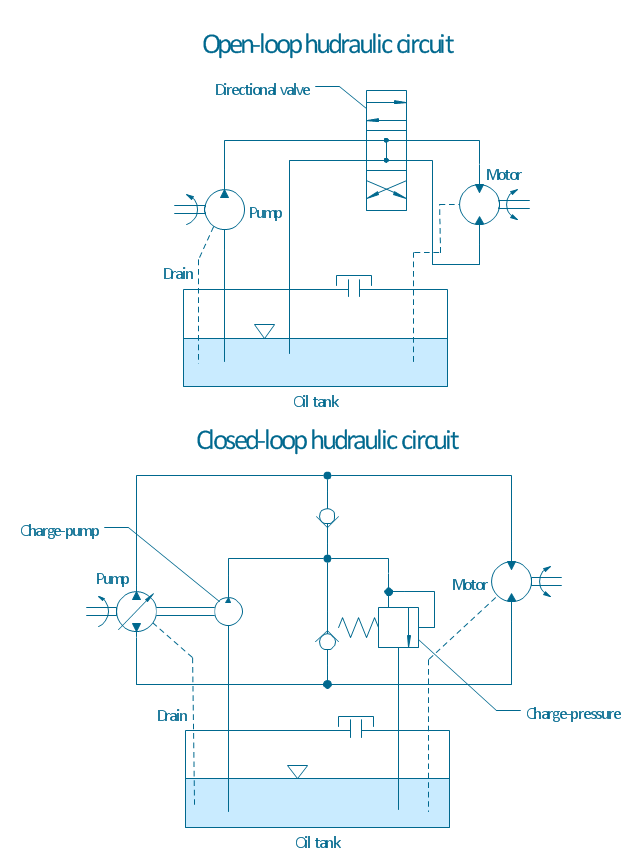
"A hydraulic circuit is a system comprising an interconnected set of discrete components that transport liquid. The purpose of this system may be to control where fluid flows (as in a network of tubes of coolant in a thermodynamic system) or to control fluid pressure (as in hydraulic amplifiers).
... hydraulic circuit theory works best when the elements (passive component such as pipes or transmission lines or active components such as power packs or pumps) are discrete and linear. This usually means that hydraulic circuit analysis works best for long, thin tubes with discrete pumps, as found in chemical process flow systems or microscale devices." [Hydraulic circuit. Wikipedia]
The engineering drawing example "Hydraulic circuits" was redrawn using ConceptDraw PRO diagramming and vector drawing software from the Wikimedia Commons file: Hydraulic circuits.png.
[commons.wikimedia.org/ wiki/ File:Hydraulic_ circuits.png]
This file is licensed under the Creative Commons Attribution-Share Alike 3.0 Unported license.
[creativecommons.org/ licenses/ by-sa/ 3.0/ deed.en]
The engineering drawing example "Hydraulic circuits" is included in the Mechanical Engineering solution from the Engineering area of ConceptDraw Solution Park.
Hydraulic circuit schematic
A four level pyramid model of different types of Information Systems based on the different levels of hierarchy in an organization. The first level represents transaction processing systems for workers. The second level represents management information systems for middle managers. The third level represents decision support systems for senior menegers. The fourth level represents executive information systems for executives.
"The "classic" view of Information systems found in the textbooks in the 1980s was of a pyramid of systems that reflected the hierarchy of the organization, usually transaction processing systems at the bottom of the pyramid, followed by management information systems, decision support systems, and ending with executive information systems at the top. Although the pyramid model remains useful, since it was first formulated a number of new technologies have been developed and new categories of information systems have emerged, some of which no longer fit easily into the original pyramid model.
Some examples of such systems are:
data warehouses,
enterprise resource planning,
enterprise systems,
expert systems,
search engines,
geographic information system,
global information system,
office automation." [Information systems. Wikipedia]
This diagram was redesigned using the ConceptDraw PRO diagramming and vector drawing software from Wikimedia Commons file Four-Level-Pyramid-model.png. [commons.wikimedia.org/ wiki/ File:Four-Level-Pyramid-model.png]
This file is licensed under the Creative Commons Attribution-Share Alike 3.0 Unported license. [creativecommons.org/ licenses/ by-sa/ 3.0/ deed.en]
The triangle chart example "Information systems types" is included in the Pyramid Diagrams solution from the Marketing area of ConceptDraw Solution Park.
Pyramid diagram

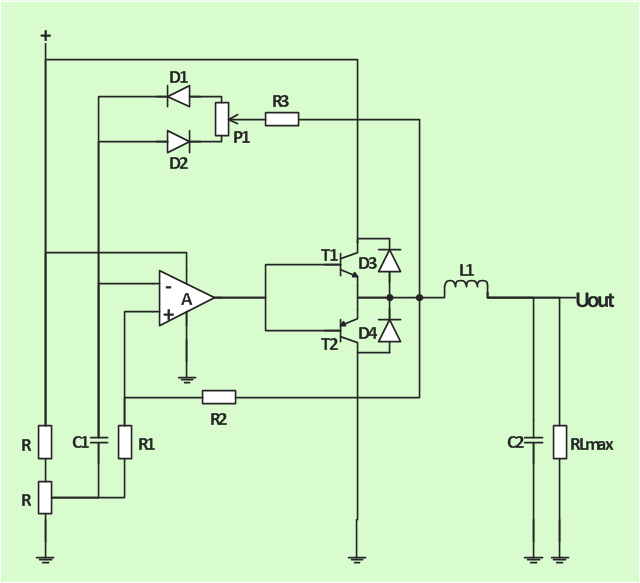
The analogue electronics diagram "Simple switched supply" was redesigned from the Wikimedia Commons file: Switchat.png.
[commons.wikimedia.org/ wiki/ File:Switchat.png]
"Analogue electronics (or analog in American English) are electronic systems with a continuously variable signal, in contrast to digital electronics where signals usually take only two different levels. The term "analogue" describes the proportional relationship between a signal and a voltage or current that represents the signal." [Analogue electronics. Wikipedia]
The circuit diagram example "Simple switched supply" was created using the ConceptDraw PRO diagramming and vector drawing software extended with the Electrical Engineering solution from the Engineering area of ConceptDraw Solution Park.
Circuit diagram
- Pict Page1 Physical Lan And Wan Diagram Template Png Draw
- Computer Vector Graphics Png
- Radio Waves Image Png
- Photographer With Camera Drawing Png
- Carpenter Icon Png
- Dish Satellite Png
- Arrow Flow Png
- Basketball positions - Vector stencils library | Basketball positions ...
- Post Man Png
- Photo gallery webpage (wireframe) | Technology - Vector stencils ...
- Basic Diagramming | Pictures of Graphs | Area Charts | Population ...
- South Asia - Political map | Geo Map - Asia - Papua New Guinea ...
- Pict Tool Example
- Pictures of Vegetables | Food Court | Food Art | Diagram Of All ...
- Architectural Infographics Png
- Asia Drawing Map Png
- Pyramid Diagram | Pyramid Diagram | Picture Graph | Pyramid Image
- 3 level pyramid model diagram of information systems types | 5 level ...
- Africa Map Png
- Picture Of Local Area Network