 Pie Charts
Pie Charts are extensively used in statistics and business for explaining data and work results, in mass media for comparison (i.e. to visualize the percentage for the parts of one total), and in many other fields. The Pie Charts solution for ConceptDraw DIAGRAM offers powerful drawing tools, varied templates, samples, and a library of vector stencils for simple construction and design of Pie Charts, Donut Chart, and Pie Graph Worksheets.
Pictures of Vegetables
 Basic Pie Charts
This solution extends the capabilities of ConceptDraw DIAGRAM (or later) with templates, samples, and a library of vector stencils for drawing pie and donut charts.
 Food Court
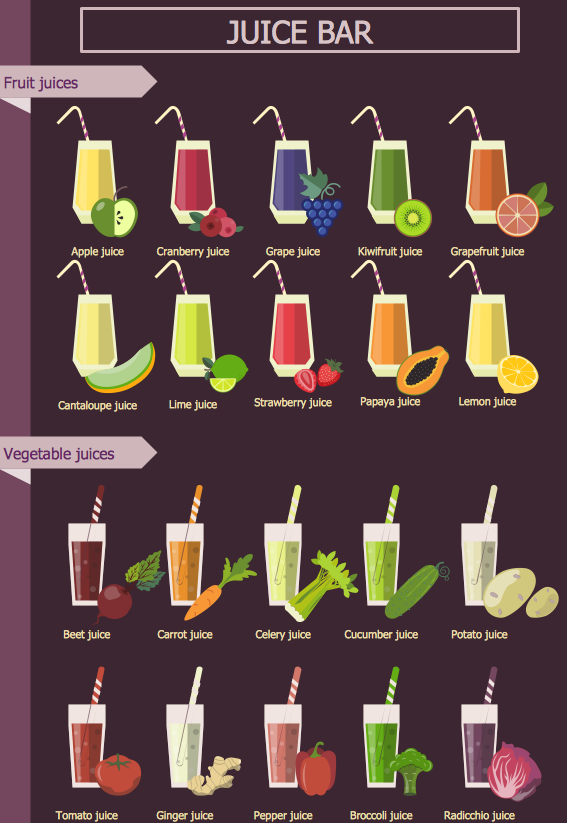
Use the Food Court solution to create food art. Pictures of food can be designed using libraries of food images, fruit art and pictures of vegetables.
 Health Food
The Health Food solution contains the set of professionally designed samples and large collection of vector graphic libraries of healthy foods symbols of fruits, vegetables, herbs, nuts, beans, seafood, meat, dairy foods, drinks, which give powerful possi
 Area Charts
Area Charts are used to display the cumulative totals over time using numbers or percentages; or to show trends over time among related attributes. The Area Chart is effective when comparing two or more quantities. Each series of data is typically represented with a different color, the use of color transparency in an object’s transparency shows overlapped areas and smaller areas hidden behind larger areas.
How to Create a Pie Chart

 Cooking Recipes
Create quick and easy recipe diagrams with the Cooking Recipes solution. Make a tasty meal for dinner, for holidays, or for a party.
Pie Chart

 Organizational Charts
Organizational Charts solution extends ConceptDraw DIAGRAM software with samples, templates and library of vector stencils for drawing the org charts.
- Pie Chart Of Components Of Food
- Pie Charts | Food Court | Bar Graphs | Pie Charts And Graphs ...
- Pie Charts | ConceptDraw Solution Park | Health Food | Draw A Pie ...
- Healthy Food Ideas | Pie Charts | Food Court | How To Draw Diet Chart
- Seating Plans | Pie Charts | How to Design a Fast- Food Restaurant ...
- Bar Charts And Pie Charts On Food Security In India
- Pie Charts | Contoh Flowchart | Picture Graphs | Graph Related To ...
- Images Of Nutrients Pie Chart With Images Of Foods
- Pie Chart And Bar Graph Of Nutrition Draw
- Pie Charts | Top 5 Android Flow Chart Apps | Health Food | Diagram ...