 Pie Charts
Pie Charts are extensively used in statistics and business for explaining data and work results, in mass media for comparison (i.e. to visualize the percentage for the parts of one total), and in many other fields. The Pie Charts solution for ConceptDraw PRO v10 offers powerful drawing tools, varied templates, samples, and a library of vector stencils for simple construction and design of Pie Charts, Donut Chart, and Pie Graph Worksheets.
 ConceptDraw Solution Park
ConceptDraw Solution Park collects graphic extensions, examples and learning materials
 Health Food
The Health Food solution contains the set of professionally designed samples and large collection of vector graphic libraries of healthy foods symbols of fruits, vegetables, herbs, nuts, beans, seafood, meat, dairy foods, drinks, which give powerful possi
 Histograms
How to make a Histogram? Making a Histogram is an incredibly easy process when it is done with ConceptDraw PRO. The Histograms Solution enhances ConceptDraw PRO v10 functionality with extensive drawing tools, numerous samples, and examples; also a quick-start template and library of ready vector stencils for visualization the data and professional drawing Histograms.
Holiday Recipes
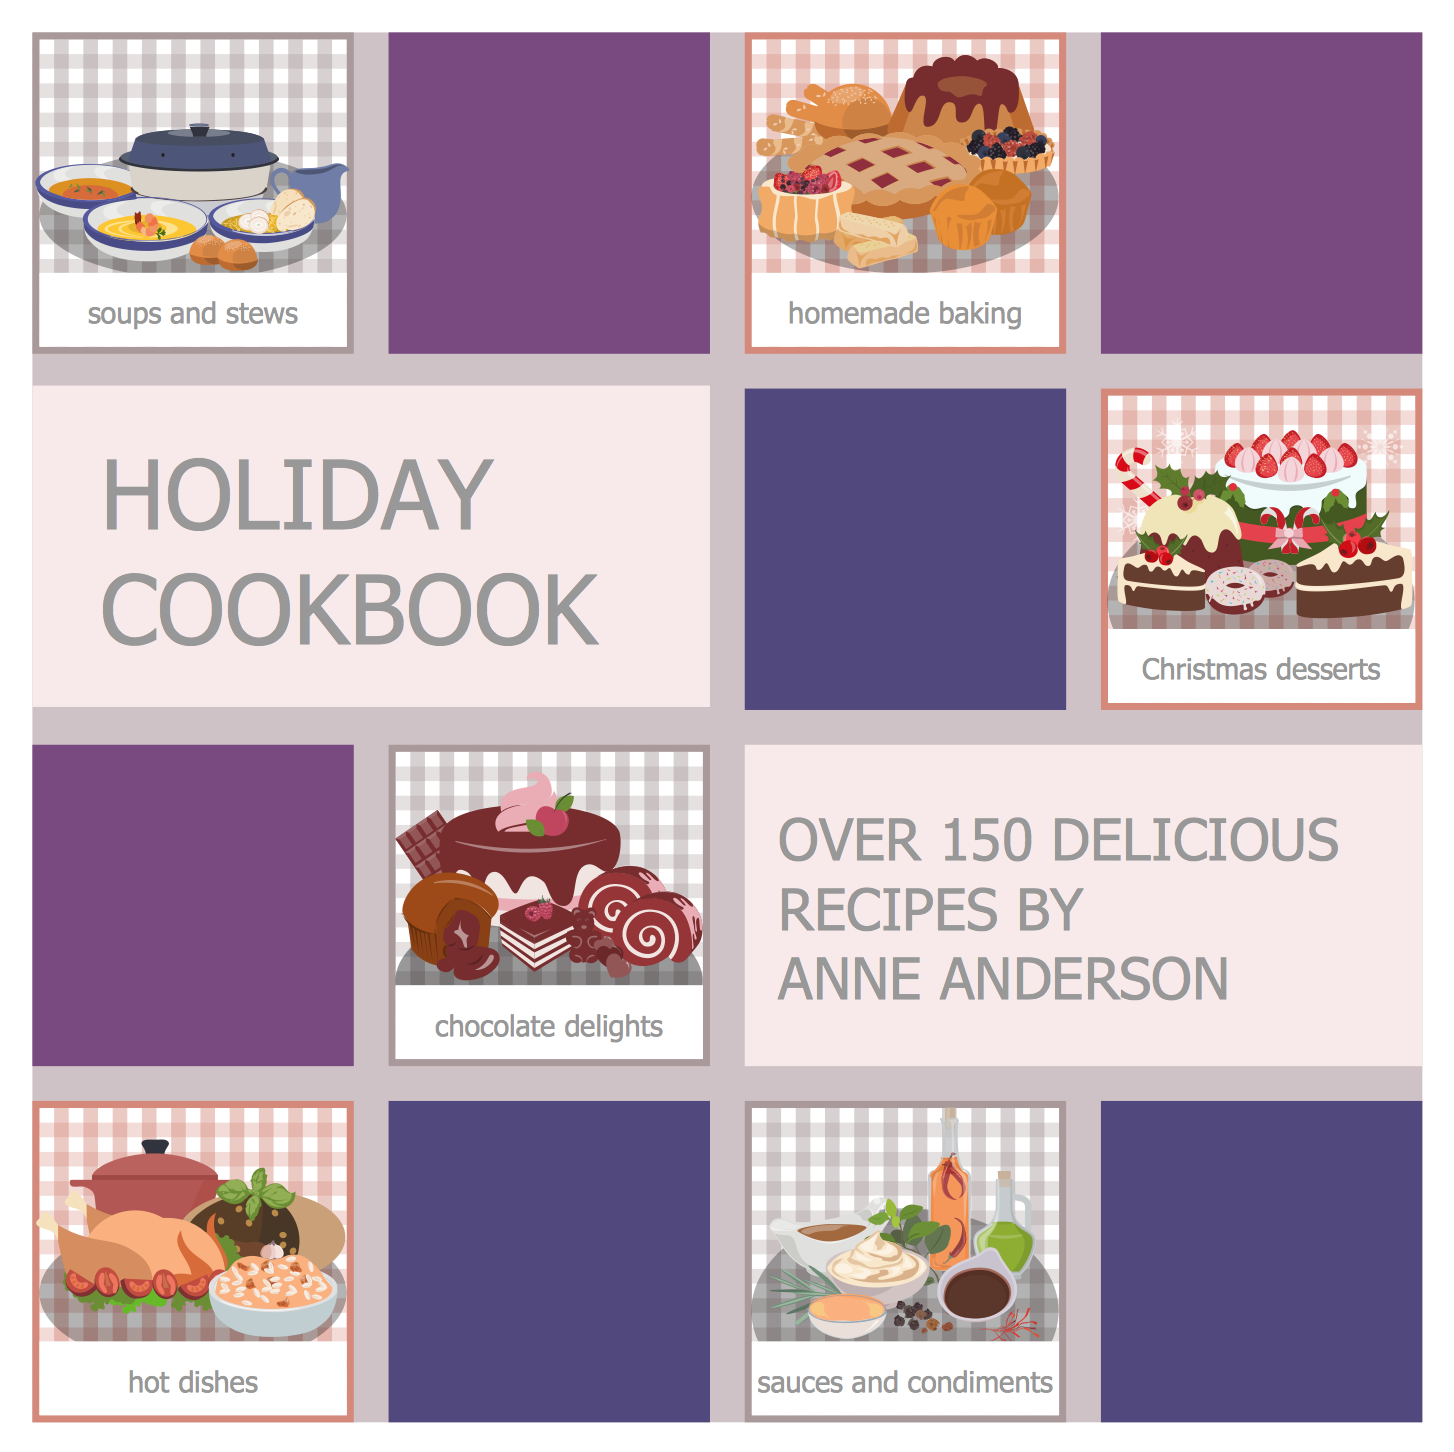
Holiday recipes are always recipes of amazingly delicious and beautiful dishes that delight by decoration and miraculous combination of ingredients, and remain long in the memory. Design of illustrations for recipes of holiday dishes for cookbooks, magazines and websites is a special art, because one of the main criteria for selection the recipe and its next cooking is colorful and appetizing illustration. ConceptDraw PRO diagramming and vector drawing software extended with powerful tools of Cooking Recipes solution from the Food and Beverage area of ConceptDraw Solution Park will help easy create colorful, bright, attractive and appetizing illustrations on preparation and decoration holiday dishes.
 Basic Histograms
This solution extends the capabilities of ConceptDraw PRO v10.3.0 (or later) with templates, samples and a library of vector stencils for drawing Histograms.
 Basic Pie Charts
This solution extends the capabilities of ConceptDraw PRO v10.3.0 (or later) with templates, samples, and a library of vector stencils for drawing pie and donut charts.
 Seven Basic Tools of Quality
Manage quality control in the workplace, using fishbone diagrams, flowcharts, Pareto charts and histograms, provided by the Seven Basic Tools of Quality solution.
 ConceptDraw Solution Park
ConceptDraw Solution Park collects graphic extensions, examples and learning materials
 ConceptDraw Solution Park
ConceptDraw Solution Park collects graphic extensions, examples and learning materials
 Frequency Distribution Dashboard
Frequency distribution dashboard solution extends ConceptDraw PRO software with samples, templates and vector stencils libraries with histograms and area charts for drawing the visual dashboards showing frequency distribution of data.
 Circle-Spoke Diagrams
Examples of subject areas that are well suited to this approach are marketing, business, products promotion, process modeling, market, resource, time, and cost analysis. Circle-Spoke Diagrams are successfully used in presentations, conferences, management documents, magazines, reportages, reviews, reports, TV, and social media.
 Area Charts
Area Charts are used to display the cumulative totals over time using numbers or percentages; or to show trends over time among related attributes. The Area Chart is effective when comparing two or more quantities. Each series of data is typically represented with a different color, the use of color transparency in an object’s transparency shows overlapped areas and smaller areas hidden behind larger areas.
- Health Food | Histograms | Pie Charts | Pie Chart And Histogram For ...
- Health Food | ConceptDraw Solution Park | Pie Charts | Drwa A Pie ...
- Sample Of Pareto Chart In Food And Beverage
- Chart For Distribution Network For Food Products
- Pie Chart Histogram
- Histograms | Basic Histograms | Chart Examples | Illustration Of ...
- Pie Chart Representation Of 2 Items
- How to Draw a Histogram in ConceptDraw PRO | Best Program to ...
- Histogram | Seven Basic Tools of Quality - Flow Chart | Seven Basic ...
- Spider Chart Template | Blank Scatter Plot | Pie Chart Examples and ...
- Geo Map - Asia - Philippines | Bar Diagram Math | Pie Charts ...
- Type Of Food Drawing Chart
- Geo Map - Asia - Philippines | Bar Diagram Math | Divided Bar ...
- Bar Diagram Math | Divided Bar Diagrams | Tools to Create Your ...
- Bar Diagram Math | Picture Graphs | Geo Map - Asia - Philippines ...
- Pie Chart Designing Process Pdf
- How to Draw a Pie Chart Using ConceptDraw PRO | Pie Charts ...
- Scatter Chart Examples | Blank Scatter Plot | Pyramid diagrams ...
- Draw The Chart For Cooking Method
