"The atmosphere of Earth is a layer of gases surrounding the planet Earth that is retained by Earth's gravity. The atmosphere protects life on Earth by absorbing ultraviolet solar radiation, warming the surface through heat retention (greenhouse effect), and reducing temperature extremes between day and night (the diurnal temperature variation).
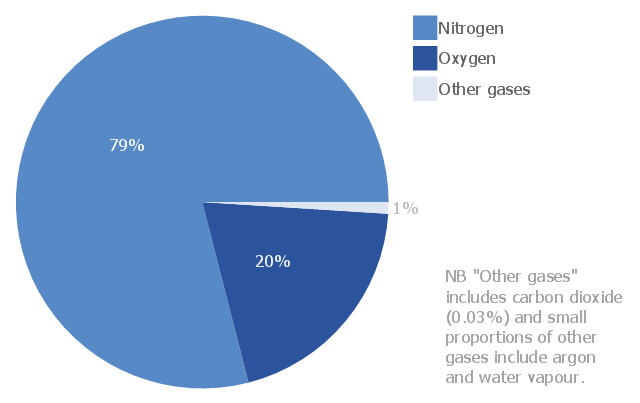
The common name given to the atmospheric gases used in breathing and photosynthesis is air. By volume, dry air contains 78.09% nitrogen, 20.95% oxygen, 0.93% argon, 0.039% carbon dioxide, and small amounts of other gases. Air also contains a variable amount of water vapor, on average around 1%. Although air content and atmospheric pressure vary at different layers, air suitable for the survival of terrestrial plants and terrestrial animals currently is only known to be found in Earth's troposphere and artificial atmospheres." [Atmosphere of Earth. Wikipedia]
This pie chart sample was redesigned from the Wikimedia Commons file: Air composition pie chart.JPG.
[commons.wikimedia.org/ wiki/ File:Air_ composition_ pie_ chart.JPG]
This file is licensed under the Creative Commons Attribution-Share Alike 3.0 Unported license. [creativecommons.org/ licenses/ by-sa/ 3.0/ deed.en]
The pie chart example "Approximate composition of the air" was created using the ConceptDraw PRO diagramming and vector drawing software extended with the Pie Charts solution of the Graphs and Charts area in ConceptDraw Solution Park.
Pie chart
Percentage Pie Chart. Pie Chart Examples

This sample shows the Pie Chart of the approximate air composition. You can see the percentage of oxygen, nitrogen and other gases in the air visualized on this Pie Chart.
Bar Diagram Math

TQM Diagram Tool

Influence Diagram Software

This sample shows the Influence diagram. It is a directed acyclic graph with three types of nodes: Decision node is drawn as a rectangle, Uncertainty node is drawn as an oval, Value node is drawn as an octagon. The nodes are connected with arcs.
Interior Design Seating Plan - Design Elements

 Divided Bar Diagrams
The Divided Bar Diagrams Solution extends the capabilities of ConceptDraw PRO v10 with templates, samples, and a library of vector stencils for drawing high impact and professional Divided Bar Diagrams and Graphs, Bar Diagram Math, and Stacked Graph.
 Chemical and Process Engineering
This chemical engineering solution extends ConceptDraw PRO v.9.5 (or later) with process flow diagram symbols, samples, process diagrams templates and libraries of design elements for creating process and instrumentation diagrams, block flow diagrams (BFD
 Security and Access Plans
This solution extends ConceptDraw PRO software with physical security plan, security chart, access chart, security plans, access schemes, access plans , CCTV System Plan samples, templates and libraries of design elements for drawing the Security and Acce
 Aerospace and Transport
This solution extends ConceptDraw PRO software with templates, samples and library of vector clipart for drawing the Aerospace and Transport Illustrations. It contains clipart of aerospace objects and transportation vehicles, office buildings and anci
- Approximate composition of the air - Pie chart | Percentage Pie ...
- Approximate composition of the air - Pie chart | Atmosphere Gases ...
- Pie Chart Of Composition Of Gases In Air
- Approximate composition of the air - Pie chart | Draw Pie Chart ...
- Approximate composition of the air - Pie chart | Approximate ...
- Pie Diagram Of Composition Of Gases
- Composition Of Various Gases In Our Atmosphere In Pie Chart
- Approximate composition of the air - Pie chart | Pia Chart Of Atmos ...
- Bar Graph Or Pie Chart Composition Of Gases
- What Are The Percentage Composition Of Gases Make A Pie Chart
- Approximate composition of the air - Pie chart | Pie Graph Of ...
- Approximate composition of the air - Pie chart | Pie Chart Of Gases ...
- Approximate composition of the air - Pie chart | Percentage Pie ...
- Pie Chart Of Air Gases Pdf
- Approximate composition of the air - Pie chart | Design elements ...
- Approximate composition of the air - Pie chart | Approximate ...
- Percentage Pie Chart . Pie Chart Examples | Approximate ...
- Construct A Pie Chart To Show The Composition Of Nitrogen ...
- Diagram Gases Composition
- Draw Percentage Of Gases