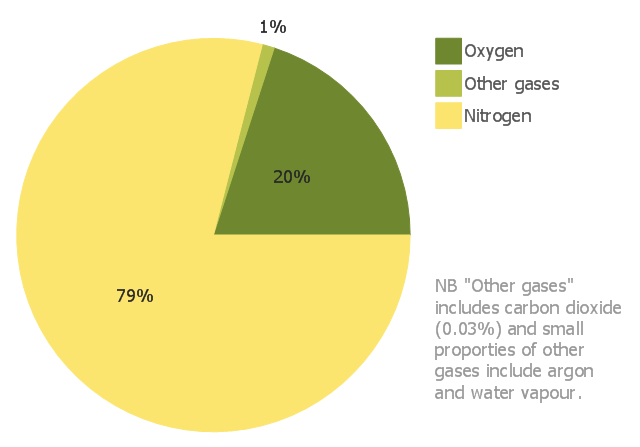
This pie chart sample shows the approximate composition of the air.
"The atmosphere of Earth is a layer of gases surrounding the planet Earth that is retained by Earth's gravity. The atmosphere protects life on Earth by absorbing ultraviolet solar radiation, warming the surface through heat retention (greenhouse effect), and reducing temperature extremes between day and night (the diurnal temperature variation).
The common name given to the atmospheric gases used in breathing and photosynthesis is air. By volume, dry air contains 78.09% nitrogen, 20.95% oxygen, 0.93% argon, 0.039% carbon dioxide, and small amounts of other gases. Air also contains a variable amount of water vapor, on average around 1%. Although air content and atmospheric pressure vary at different layers, air suitable for the survival of terrestrial plants and terrestrial animals currently is only known to be found in Earth's troposphere and artificial atmospheres." [Atmosphere of Earth. Wikipedia]
This pie chart sample was redesigned from the Wikimedia Commons file: Air composition pie chart.JPG.
[commons.wikimedia.org/ wiki/ File:Air_ composition_ pie_ chart.JPG]
This file is licensed under the Creative Commons Attribution-Share Alike 3.0 Unported license. [creativecommons.org/ licenses/ by-sa/ 3.0/ deed.en]
The pie chart example "Approximate composition of the air" was created using the ConceptDraw PRO diagramming and vector drawing software extended with the Basic Pie Charts solution of the Graphs and Charts area in ConceptDraw Solution Park.
Pie chart
Pie Donut Chart. Pie Chart Examples

Pie Chart Examples and Templates

Business Report Pie. Pie Chart Examples

Pie Chart

Pie Chart Word Template. Pie Chart Examples

Waterfall Bar Chart

How to Deliver Presentations using Mind Maps

Chart Maker for Presentations

 HVAC Plans
Use HVAC Plans solution to create professional, clear and vivid HVAC-systems design plans, which represent effectively your HVAC marketing plan ideas, develop plans for modern ventilation units, central air heaters, to display the refrigeration systems for automated buildings control, environmental control, and energy systems.
- Atmosphere air composition | Percentage Pie Chart . Pie Chart ...
- Percentage Pie Chart . Pie Chart Examples | Atmosphere air ...
- Atmosphere air composition | Pie Chart Examples and Templates ...
- Atmosphere air composition | Basic Pie Charts | Atmosphere air ...
- Approximate composition of the air - Pie chart | Pie Graph ...
- Atmosphere air composition | Best Tool for Infographic Construction ...
- Atmosphere air composition | Waterfall Bar Chart | Pie Graph ...
- Components Of Air Pie Chart
- Make A Pie Chart To Show The Composition Of Air
- Pie Graph Of Atmosphere Gases