 Pie Charts
Pie Charts are extensively used in statistics and business for explaining data and work results, in mass media for comparison (i.e. to visualize the percentage for the parts of one total), and in many other fields. The Pie Charts solution for ConceptDraw PRO v10 offers powerful drawing tools, varied templates, samples, and a library of vector stencils for simple construction and design of Pie Charts, Donut Chart, and Pie Graph Worksheets.
 Basic Pie Charts
This solution extends the capabilities of ConceptDraw PRO v10.3.0 (or later) with templates, samples, and a library of vector stencils for drawing pie and donut charts.
 Nature
This solution extends ConceptDraw PRO software with samples, templates and libraries of vector clipart for drawing the Nature illustrations. Use it to make professional-looking documents, presentations and websites illustrated with color scalable vector c
 ConceptDraw Solution Park
ConceptDraw Solution Park collects graphic extensions, examples and learning materials
 Cross-Functional Flowcharts
Cross-functional flowcharts are powerful and useful tool for visualizing and analyzing complex business processes which requires involvement of multiple people, teams or even departments. They let clearly represent a sequence of the process steps, the order of operations, relationships between processes and responsible functional units (such as departments or positions).
Create Graphs and Charts
Charting Software allows you to create diagrams, charts, graphs, flowcharts, and other business graphics. ConceptDraw PRO include simple shape drawing tools, examples, templates, and symbol libraries.Four Dimensions Bubble Plot
This sample was created in ConceptDraw PRO diagramming and vector drawing software using the Bubble Diagrams Solution from the "What is a Diagram" area of ConceptDraw Solution Park. This sample clearly shows the Four Dimensions Bubble Diagram of the distribution of chlorine contaminant in the water source. This Bubble Diagram is very useful in the chemistry, hydrology, and ecology.
 Visio Exchange
Our Visio Exchange tool allows you to Import and export native MS Visio 2013 files that are in the new MS Visio drawing (VSDX) format introduced in the most recent Visio iteration. In addition, ConceptDraw PRO v10 supports the import and export of MS Visio 2007-2010 XML. (VDX) files more accurately then previous versions of ConceptDraw PRO. If you have the older MS Visio 2007-2010.
 Project Exchange
This solution extends ConceptDraw PROJECT and ConceptDraw MINDMAP software with the ability to import and export project data.
 Block Diagrams
Block diagrams solution extends ConceptDraw PRO software with templates, samples and libraries of vector stencils for drawing the block diagrams.
Form Maker
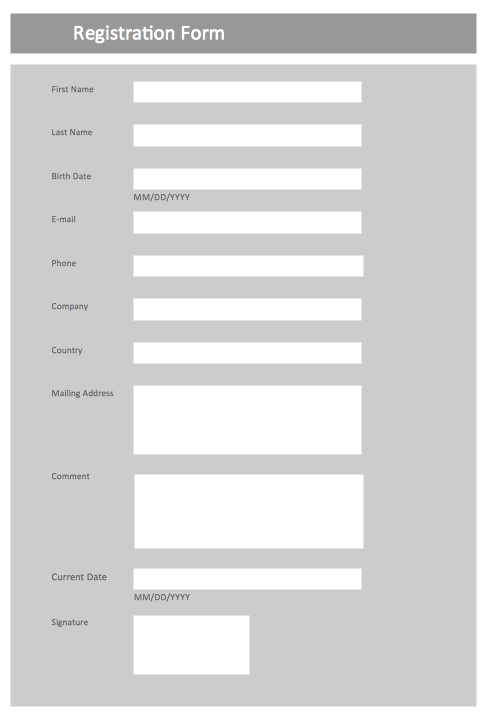
Use the Basic Diagramming Solution from the Universal Diagramming area of ConceptDraw Solution Park to easy create simple forms, questionnaires, survey forms, registration and application forms, etc.
 Composition Dashboard
Composition dashboard solution extends ConceptDraw PRO software with templates, samples and vector stencils library with charts and indicators for drawing visual dashboards showing data composition.
 Bar Graphs
The Bar Graphs solution enhances ConceptDraw PRO v10 functionality with templates, numerous professional-looking samples, and a library of vector stencils for drawing different types of Bar Graphs, such as Simple Bar Graph, Double Bar Graph, Divided Bar Graph, Horizontal Bar Graph, Vertical Bar Graph, and Column Bar Chart.
 Organizational Charts
Organizational Charts solution extends ConceptDraw PRO software with samples, templates and library of vector stencils for drawing the org charts.
 Target and Circular Diagrams
This solution extends ConceptDraw PRO software with samples, templates and library of design elements for drawing the Target and Circular Diagrams.
- Pie Charts | Percentage Diagram Air Quantity Nature
- Approximate composition of the air - Pie chart | Bar Diagrams for ...
- Beautiful Nature Scene: Drawing | Process Flow Chart | Beauty of ...
- Approximate composition of the air - Pie chart | Pie Charts ...
- Basic Diagramming | Drawing Illustration | Beautiful Nature Scene ...
- Chart For Nature
- Approximate composition of the air - Pie chart | Stars and planets ...
- Rainfall Bar Chart | Renewable energy | Graph And Pie Chart On Rain
- Hd Diagram Of Nature Of Accounting
- Basic Diagramming | Beautiful Nature Scene: Drawing | Chemistry ...
- Process Flowchart | Pie Chart Examples and Templates | Basic ...
- Workflow diagram - Weather forecast | Pie Charts | Interior Design ...
- Atmosphere air composition | Percentage Pie Chart . Pie Chart ...
- How to Draw | Beautiful Nature Scene: Drawing
- Resources and energy - Vector stencils library | Energy Pyramid ...
- Life cycle analysis - Ring chart | Pie Charts On Production Of Energy ...
- Pie Chart On Natural Resources
- Approximate composition of the air - Pie chart | Design elements ...
- Bar Graph And Pie Chart About Management Of Natural Resourses
- Drawing Illustration | Beautiful Nature Scene: Drawing | How can ...


