Scatter Graph Charting Software

 Picture Graphs
Typically, a Picture Graph has very broad usage. They many times used successfully in marketing, management, and manufacturing. The Picture Graphs Solution extends the capabilities of ConceptDraw DIAGRAM with templates, samples, and a library of professionally developed vector stencils for designing Picture Graphs.
Business Report Pie. Pie Chart Examples

 Basic Picture Graphs
This solution extends the capabilities of ConceptDraw DIAGRAM (or later) with templates, samples and a library of vector stencils for drawing Picture Graphs.
Business Diagram Software


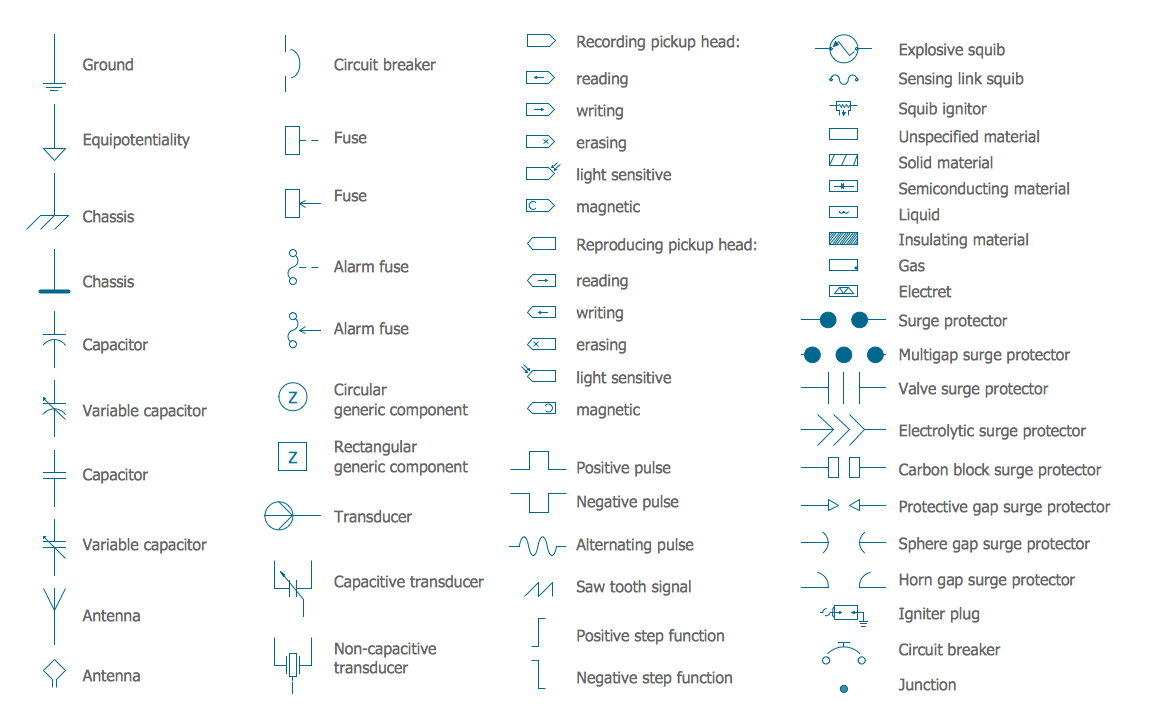
Electrical Symbols — Electrical Circuits
 Graphs and Charts Area
Solutions from the Graphs and Charts Area of ConceptDraw Solution Park collect templates, samples and libraries of vector stencils for visualization of numerical data.
 Scatter Diagrams
The Scatter Diagrams solution extends ConceptDraw DIAGRAM functionality with templates, samples, and a library of vector stencils that make construction of a Scatter Plot easy. The Scatter Chart Solution makes it easy to design attractive Scatter Diagrams used in various fields of science, work, and life activities. ConceptDraw DIAGRAM lets you enter the data to the table and construct the Scatter Plot Graph automatically according to these data.
 Divided Bar Diagrams
The Divided Bar Diagrams Solution extends the capabilities of ConceptDraw DIAGRAM with templates, samples, and a library of vector stencils for drawing high impact and professional Divided Bar Diagrams and Graphs, Bar Diagram Math, and Stacked Graph.
 Education Package
Education Package is a comprehensive set of multifarious graphical solutions from ConceptDraw Solution Park, collected together in help to ConceptDraw DIAGRAM users working in a field of science, education and training, which is aimed at improving the quality of education and helping to design with ease variety of interesting and colorful educational materials, diagrams, charts and maps. Use it to present the information and knowledge in an interesting, clear, structured and simple form to achieve a success in education and pedagogy, to maintain the interest of students and pupils throughout the whole learning process, at the lectures, lessons and even during independent work with additional materials, to contribute to better perception of scientific information by listeners during the conferences and reports.
 Area Charts
Area Charts are used to display the cumulative totals over time using numbers or percentages; or to show trends over time among related attributes. The Area Chart is effective when comparing two or more quantities. Each series of data is typically represented with a different color, the use of color transparency in an object’s transparency shows overlapped areas and smaller areas hidden behind larger areas.
 Basic Divided Bar Diagrams
This solution extends the capabilities of ConceptDraw DIAGRAM with templates, samples and a library of vector stencils for drawing Divided Bar diagrams.
 Marketing Diagrams
Marketing Diagrams solution extends ConceptDraw DIAGRAM diagramming software with abundance of samples, templates and vector design elements intended for easy graphical visualization and drawing different types of Marketing diagrams and graphs, including Branding Strategies Diagram, Five Forces Model Diagram, Decision Tree Diagram, Puzzle Diagram, Step Diagram, Process Chart, Strategy Map, Funnel Diagram, Value Chain Diagram, Ladder of Customer Loyalty Diagram, Leaky Bucket Diagram, Promotional Mix Diagram, Service-Goods Continuum Diagram, Six Markets Model Diagram, Sources of Customer Satisfaction Diagram, etc. Analyze effectively the marketing activity of your company and apply the optimal marketing methods with ConceptDraw DIAGRAM software.
 Pie Charts
Pie Charts are extensively used in statistics and business for explaining data and work results, in mass media for comparison (i.e. to visualize the percentage for the parts of one total), and in many other fields. The Pie Charts solution for ConceptDraw DIAGRAM offers powerful drawing tools, varied templates, samples, and a library of vector stencils for simple construction and design of Pie Charts, Donut Chart, and Pie Graph Worksheets.
 Line Graphs
How to draw a Line Graph with ease? The Line Graphs solution extends the capabilities of ConceptDraw DIAGRAM with professionally designed templates, samples, and a library of vector stencils for drawing perfect Line Graphs.
- Sample Pictorial Chart . Sample Infographics | Design elements ...
- Line Chart Examples | Sample Pictorial Chart . Sample Infographics ...
- How to Create a Picture Graph in ConceptDraw PRO | Sample ...
- Manufacturing in America | Picture graph - Template | Total value of ...
- Scatter Graph Charting Software | Sample Pictorial Chart . Sample ...
- Bar Graph | Scatter Plot | Scatter Chart Examples | Blank Picture Graph
- Blank Scatter Plot | How to Draw a Pictorial Chart in ConceptDraw ...
- Picture Graphs | Pie Chart Word Template. Pie Chart Examples | Bar ...
- The Pictorial Picture Bar Chart And Histogram
- Design elements - Picture bar graphs
- How to Draw a Pictorial Chart in ConceptDraw PRO | How to Draw ...
- Business Report Pie. Pie Chart Examples | Examples of Flowcharts ...
- Line Chart Template for Word | Scatter graph - Template | Double ...
- How to Draw a Pictorial Chart in ConceptDraw PRO | How to Draw ...
- Design elements - Picture bar graphs | Column Chart Software | Bar ...
- Picture Graphs | What Is a Picture Graph ? | How to Create a Picture ...
- Picture Graphs | Bar Diagram Math | Pie Charts | Natural Resource ...
- Maths Pie Chart Design Image
- Scatter Chart Examples | Blank Scatter Plot | Scatter Graph | Scatter ...
- Picture Chart Templates