This pictorial chart sample shows the population growth by continent in 2010-2013.
"Population growth' refers to the growth in human populations. Global population growth is around 80 million annually, or 1.2% p.a. The global population has grown from 1 billion in 1800 to 7 billion in 2012. It is expected to keep growing to reach 11 billion by the end of the century. Most of the growth occurs in the nations with the most poverty, showing the direct link between high population growth and low standards of living. The nations with high standards of living generally have low or zero rates of population growth. Australia's population growth is around 400,000 annually, or 1.8% p.a., which is nearly double the global average. It is caused mainly by very high immigration of around 200,000 p.a., the highest immigration rate in the world. Australia remains the only nation in the world with both high population growth and high standards of living." [Population growth. Wikipedia]
The image chart example "Population growth by continent, 2010 - 2013" was created using the ConceptDraw PRO diagramming and vector drawing software extended with the Basic Picture Graphs solution from the Graphs and Charts area of ConceptDraw Solution Park.
Image chart

Sample Pictorial Chart. Sample Infographics
")
Design Pictorial Infographics. Design Infographics

How to Draw Pictorial Chart. How to Use Infograms

This picture bar graph sample shows increse in subscibers on YouTube to Anonymous' videos in 2008. It was designed on the base of the Wikimedia Commons file: A graph to show the increse in subscibers on YouTube to Anonymous' videos.jpg. [commons.wikimedia.org/ wiki/ File:A_ graph_ to_ show_ the_ increse_ in_ subscibers_ on_ YouTube_ to_ Anonymous%27_ videos.jpg]
This file is licensed under the Creative Commons Attribution 3.0 Unported license. [creativecommons.org/ licenses/ by/ 3.0/ deed.en]
"Anonymous (used as a mass noun) is a loosely associated international network of activist and hacktivist entities. A website nominally associated with the group describes it as "an internet gathering" with "a very loose and decentralized command structure that operates on ideas rather than directives". The group became known for a series of well-publicized publicity stunts and distributed denial-of-service (DDoS) attacks on government, religious, and corporate websites.
Anonymous originated in 2003 on the imageboard 4chan, representing the concept of many online and offline community users simultaneously existing as an anarchic, digitized global brain. Anonymous members (known as "Anons") can be distinguished in public by the wearing of stylised Guy Fawkes masks." [Anonymous (group). Wikipedia]
The pictorial chart example "The increse in subscibers on YouTube to Anonymous' videos" was created using the ConceptDraw PRO diagramming and vector drawing software extended with the Picture Graphs solution from the Graphs and Charts area of ConceptDraw Solution Park.
Image chart
This picture bar graph sample shows regional population growth from 2010 to 2016. It was designed using data from the Wikipedia article List of continents by population.
[en.wikipedia.org/ wiki/ List_ of_ continents_ by_ population]
"Population geography is a division of human geography. It is the study of the ways in which spatial variations in the distribution, composition, migration, and growth of populations are related to the nature of places. Population geography involves demography in a geographical perspective. It focuses on the characteristics of population distributions that change in a spatial context." [Population geography. Wikipedia]
The pictorial chart example "Regional population growth from 2010 to 2016" was created using the ConceptDraw PRO diagramming and vector drawing software extended with the Picture Graphs solution from the Graphs and Charts area of ConceptDraw Solution Park.
Image chart

Pictorial Chart

This picture bar graph sample shows the computer and Internet use at home from 1984 to 2014. It was designed using data from website of the United States Census Bureau (USCB).
[census.gov/ content/ dam/ Census/ library/ visualizations/ 2016/ comm/ digital_ nation.png]
"Home automation is the residential extension of building automation and involves the control and automation of lighting, heating, ventilation, air conditioning (HVAC), appliances, and security. Modern systems generally consist of switches and sensors connected to a central hub sometimes called a "gateway" from which the system is controlled with a user interface that is interacted either with a wall-mounted terminal, mobile phone software, tablet computer or a web interface." [Home automation. Wikipedia]
The pictorial chart example "Computer and Internet use at home over time" was created using the ConceptDraw PRO diagramming and vector drawing software extended with the Picture Graphs solution from the Graphs and Charts area of ConceptDraw Solution Park.
Image chart

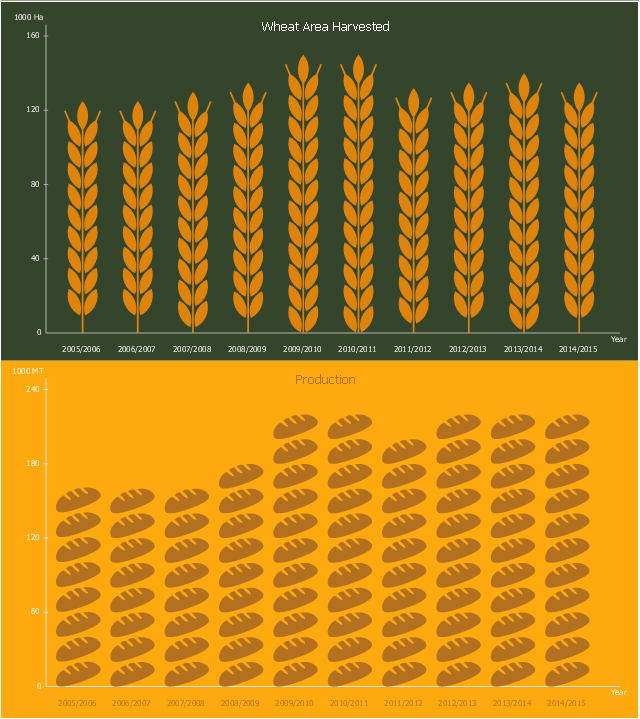
This picture bar graph sample shows wheat area harvested and production in Peru from 2006 to 2015. It was designed using data from website of the Foreign Agriculfural Service, the U.S. Department of Agriculture (USDA).
"Wheat remains a minor crop in Peru with most of the production concentrated in the temperate, southern highlands. Grown at 2,800 to 3,500 meters above sea level, production remains limited by geography as well as current economics. The Peruvian farmer cultivates only about two hectares of wheat, on average. While wheat production has increased slightly since 1994, it has remained relatively stable for the last six years at around 225,000 MT."
[fas.usda.gov/ data/ peru-wheat-production-limited-competition-corn-and-quinoa]
The pictorial chart example "Peru wheat area and production" was created using the ConceptDraw PRO diagramming and vector drawing software extended with the Picture Graphs solution from the Graphs and Charts area of ConceptDraw Solution Park.
Image chart
 Picture Graphs
Typically, a Picture Graph has very broad usage. They many times used successfully in marketing, management, and manufacturing. The Picture Graphs Solution extends the capabilities of ConceptDraw PRO v10 with templates, samples, and a library of professionally developed vector stencils for designing Picture Graphs.
Basic Flowchart Images. Flowchart Examples

 Basic Picture Graphs
This solution extends the capabilities of ConceptDraw PRO v10.3.0 (or later) with templates, samples and a library of vector stencils for drawing Picture Graphs.
Best Program to Make Workflow Diagrams

Infographic Maker

Excellent Examples of Infographic Maps

- How to Draw a Pictorial Chart in ConceptDraw PRO | How to Draw ...
- Sample Pictorial Chart . Sample Infographics | Picture Graphs ...
- How to Draw Pictorial Chart . How to Use Infograms | Network ...
- Images On World Population For Chart Making
- Picture Graph
- Sample Pictorial Chart . Sample Infographics | Design elements ...
- Food Pictures | Pictorial Chart On Balanced Diet
- Picture graphs - Vector stencils library | How to Draw Pictorial Chart ...
- Bar Graphs | Sales Growth. Bar Graphs Example | How to Draw a ...
- The Picture Of Pictorial Chart
- Picture Graph | Picture Graphs | How to Create a Picture Graph in ...
- Design elements - Picture graphs | Pictorial Chart Imeges
- Flow Chart Of Population Education Images
- Picture Graphs | What Is a Picture Graph? | How to Create a Picture ...
- How to Draw Pictorial Chart . How to Use Infograms | Picture graphs ...
- Design Pictorial Infographics. Design Infographics | Food Pictures ...
- Rainfall Bar Chart | Picture Graph | Picture Graphs | Bar Graph Images
- Pictorial Chart Agriculture
- Drawing Images Of Chart Of Balanced Diet
- Design elements - Picture bar graphs | What Is a Picture Graph ...