Design Pictorial Infographics. Design Infographics
In the course of recent decades data visualization went through significant development and has become an indispensable tool of journalism, business intelligence and science. The way visual information may be conveyed is not limited simply to static or dynamic representation, it can also be interactive. Infographics can be conditionally divided into several general levels. Primarily, this is level of visualization of information, its interpretation and association on any ground. Second level can be defined as a visualization of knowledge, depiction of thoughts and ideas in the form of images or diagrams. Finally, the level of data visualization, which processes data arrays in charts, enabling the information to be more clearly perceived. You can also identify the main approaches to the creation of infographics: exploratory and narrative. Exploratory method insists on minimalist design in favor of data precision without unnecessary details and is common for scientific researches and anaGHS Label Pictograms
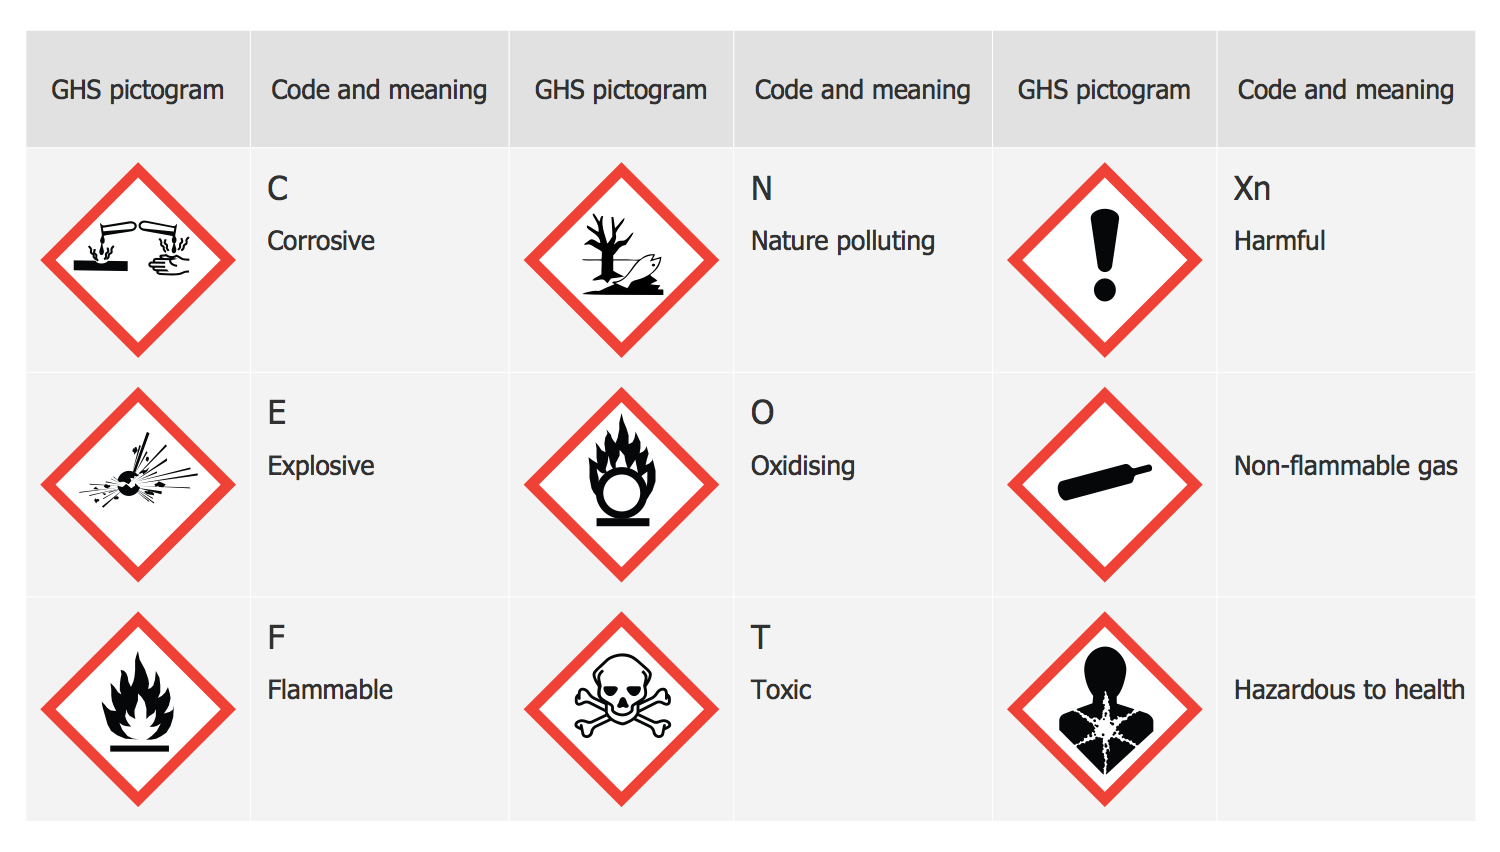
How to create the diagram explaining the danger of a certain chemical element or compound? It’s very easy with powerful ConceptDraw PRO software, the GHS Hazard Pictograms Solution included to the Engineering Area of ConceptDraw Solution Park and numerous predesigned GHS Label Pictograms from the GHS Hazard Pictograms library.
 GHS Hazard Pictograms
GHS Hazard Pictograms solution contains the set of predesigned standard GHS pictograms, Hazardous symbols, and Hazard communication pictograms, approved and agreed by UN in Globally Harmonized System of Classification and Labelling of Chemicals (GHS). They can be used for quick and simple designing accurate and professional-looking infographics, diagrams, warning announcements, signboards, posters, precautionary declarations, regulatory documents, and for representing the main items of OSHA HAZCOM Standard.
How to Draw Pictorial Chart. How to Use Infograms
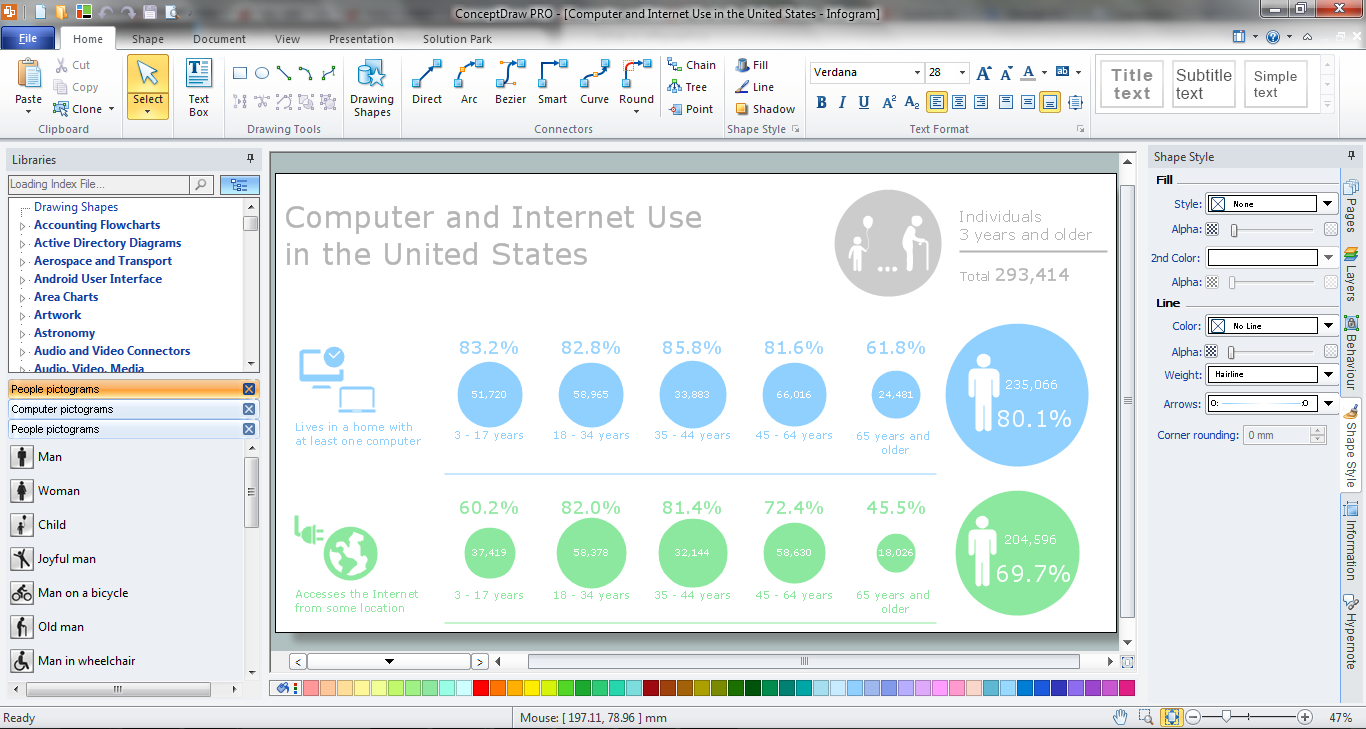
How to draw pictorial chart quick, easy and effective? ConceptDraw PRO offers the unique Pictorial Infographics Solution that will help you! Pictorial Infographics solution contains large number of libraries with variety of predesigned vector pictograms that allows you design infographics in minutes. There are available 10 libraries with 197 vector pictograms.Spatial infographics Design Elements: Transport Map
Do you like infographics and data visualization? Creating infographics is super-easy with ConceptDraw.Infographic Maker
Infographic is a visual way of representing various information, data, knowledge in statistics, geography, journalism, education, and much more areas. ConceptDraw PRO supplied with Pictorial Infographics Solution from the “What are Infographics” Area, provides a set of powerful pictorial infographics tools. Thanks to them it is the best Infographic Maker.Infographic Software
ConceptDraw PRO extended with Pictorial Infographics Solution from the “What are Infographics” Area is a powerful Infographic Software. Make sure in it right now!Pictorial Chart
You want design Pictorial Chart or Infographic? And you need powerful infographic software? Then ConceptDraw PRO diagramming and vector drawing software extended with Pictorial Infographics Solution from the “What are Infographics” Area is exactly what you need.
 Fishbone Diagram
Fishbone Diagrams solution extends ConceptDraw PRO software with templates, samples and library of vector stencils for drawing the Ishikawa diagrams for cause and effect analysis.
 Sales Flowcharts
The Sales Flowcharts solution lets you create and display sales process maps, sales process workflows, sales steps, the sales process, and anything else involving sales process management.
 Aerospace and Transport
This solution extends ConceptDraw PRO software with templates, samples and library of vector clipart for drawing the Aerospace and Transport Illustrations. It contains clipart of aerospace objects and transportation vehicles, office buildings and anci
 Pie Charts
Pie Charts are extensively used in statistics and business for explaining data and work results, in mass media for comparison (i.e. to visualize the percentage for the parts of one total), and in many other fields. The Pie Charts solution for ConceptDraw PRO v10 offers powerful drawing tools, varied templates, samples, and a library of vector stencils for simple construction and design of Pie Charts, Donut Chart, and Pie Graph Worksheets.
 iPhone User Interface
iPhone User Interface solution extends ConceptDraw PRO v10 software with templates, samples and libraries with large quantity of vector stencils of graphical user interface elements, Apps icons, UI patterns for designing and prototyping of the iOS applic
 Network Security Diagrams
The Network Security Diagrams solution enhances the ConceptDraw PRO v10 functionality with large collection of predesigned vector stencils of cybersecurity clipart, shapes, icons and connectors to help you succeed in designing professional and accurate Ne
- Transport pictograms - Vector stencils library | Kids Toys 2d Vector Png
- Aerospace and Transport | Transport pictograms - Vector stencils ...
- Transport pictograms - Vector stencils library | Motorbike Vector Png
- Aircraft - Vector stencils library | Transport pictograms - Vector ...
- Transport pictograms - Vector stencils library | Passanger Car Icon Png
- Transport pictograms - Vector stencils library | Aerostat Png
- Road transport - Vector stencils library | Industrial transport - Vector ...
- Funny transport - Vector stencils library | Transport pictograms ...
- Transport pictograms - Vector stencils library | Watercraft - Vector ...
- Transport pictograms - Vector stencils library | Transport pictograms ...
- Marketing Plan Infographic | Transport pictograms - Vector stencils ...
- Network Visualization with ConceptDraw PRO | Transport ...
- Funny transport - Vector stencils library | Transport pictograms ...
- Transport pictograms - Vector stencils library | Road transport ...
- Process Flowchart | Transport pictograms - Vector stencils library ...
- Landmarks - Vector stencils library | Transport pictograms - Vector ...
- Transport pictograms - Vector stencils library | Marketing - Vector ...
- Road transport - Vector stencils library | Transport pictograms ...
- Animals - Vector stencils library | Pictogram Movement Png Vector
- Road Transport - Design Elements | Aerospace and Transport ...


