This site uses cookies. By continuing to browse the ConceptDraw site you are agreeing to our Use of Site Cookies.

Infographic Maker

Infographic is a visual way of representing various information, data, knowledge in statistics, geography, journalism, education, and much more areas. ConceptDraw DIAGRAM supplied with Pictorial Infographics Solution from the “Infographics” Area, provides a set of powerful pictorial infographics tools. Thanks to them it is the best Infographic Maker.

How to Draw Pictorial Chart. How to Use Infograms

How to draw pictorial chart quick, easy and effective? ConceptDraw DIAGRAM offers the unique Pictorial Infographics Solution that will help you!
Pictorial Infographics solution contains large number of libraries with variety of predesigned vector pictograms that allows you design infographics in minutes. There are available 10 libraries with 197 vector pictograms.

Flowchart Components

The ConceptDraw Flowchart component includes a set of samples and templates. This geathered as flowchart maker toolbox which focused on drawing flowcharts of any industry standards.

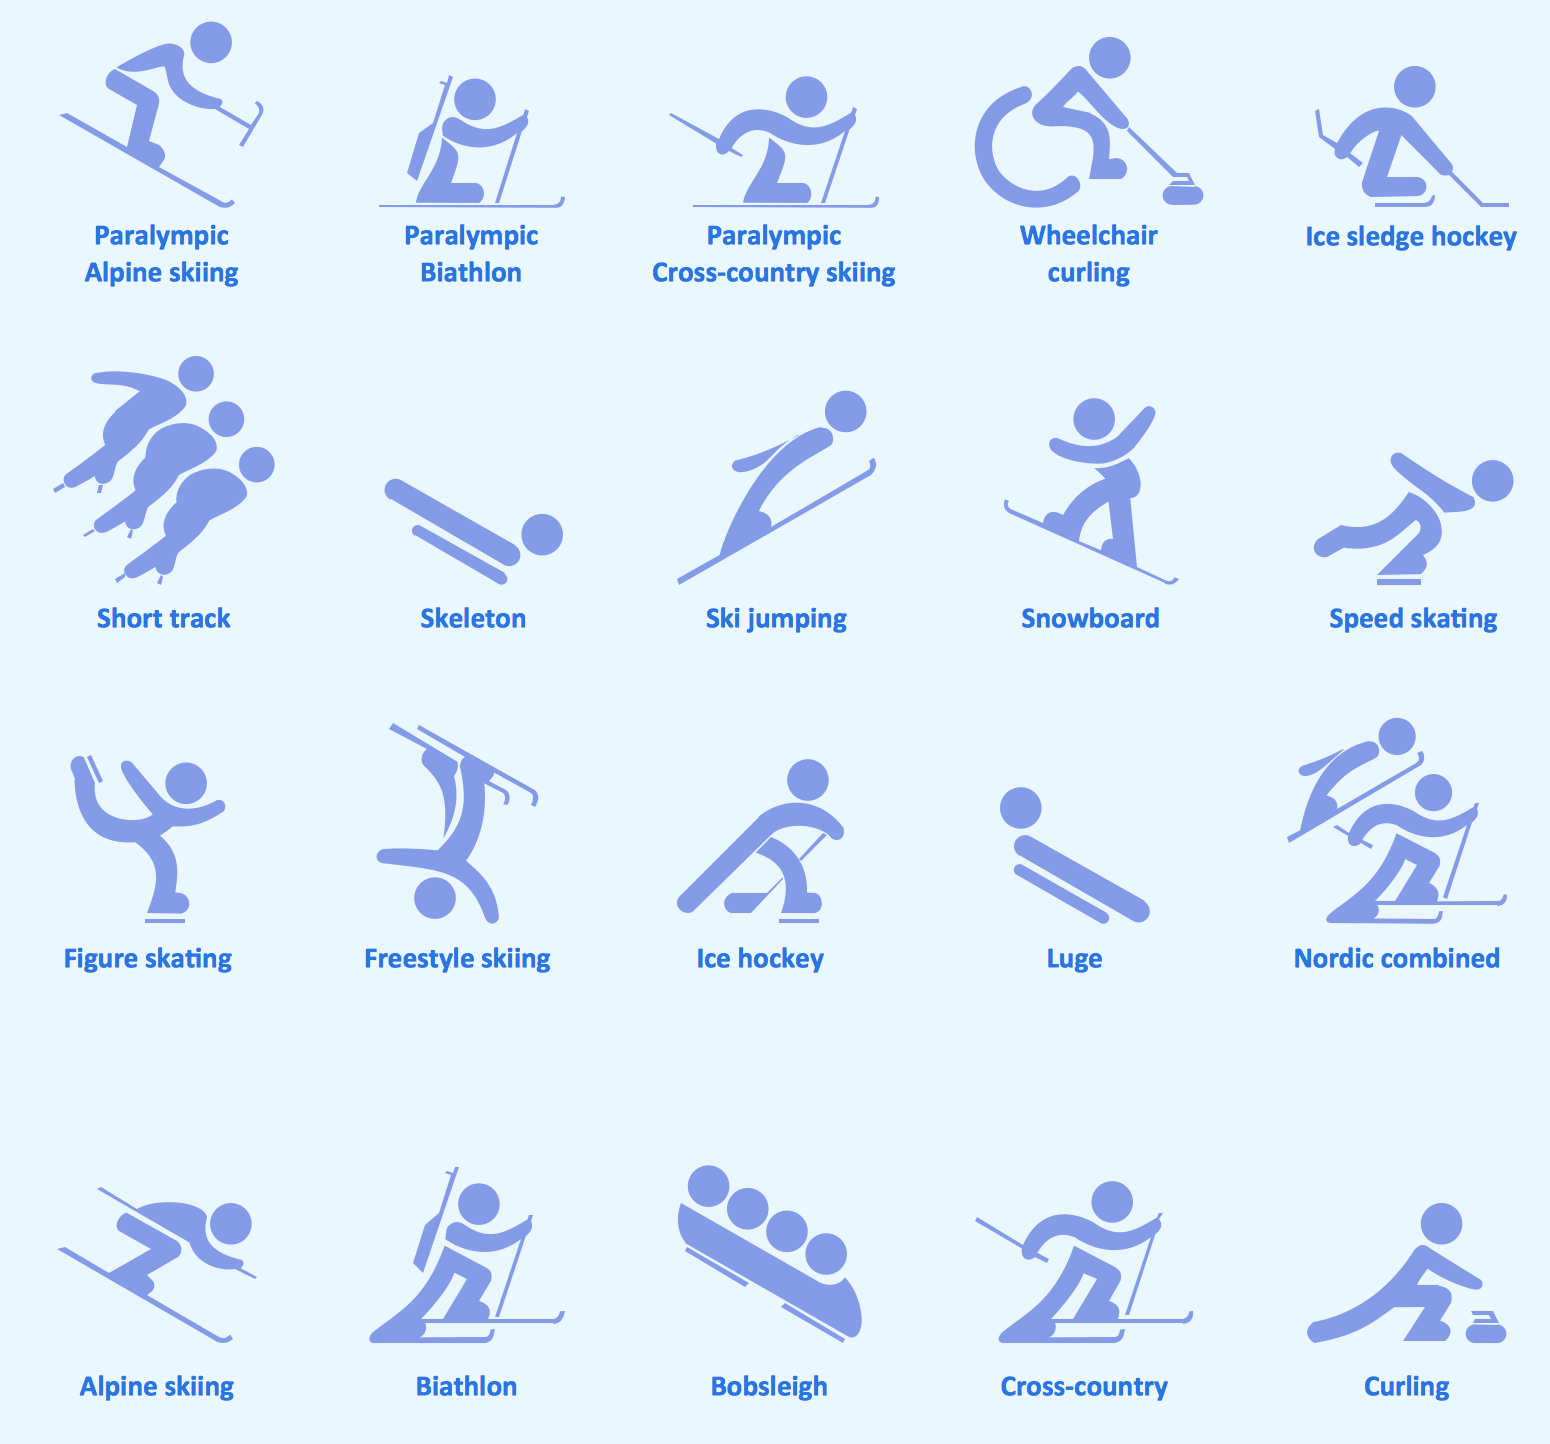
Sport pictograms. Olympic Games

The Winter Sports solution from Sport Area of ConceptDraw Solution Park contains winter sports pictograms you may use illustrating any kind of material about Olympic Games or any other sport competitions.

Design Pictorial Infographics. Design Infographics

In the course of recent decades data visualization went through significant development and has become an indispensable tool of journalism, business intelligence and science. The way visual information may be conveyed is not limited simply to static or dynamic representation, it can also be interactive. Infographics can be conditionally divided into several general levels. Primarily, this is level of visualization of information, its interpretation and association on any ground. Second level can be defined as a visualization of knowledge, depiction of thoughts and ideas in the form of images or diagrams. Finally, the level of data visualization, which processes data arrays in charts, enabling the information to be more clearly perceived. You can also identify the main approaches to the creation of infographics: exploratory and narrative. Exploratory method insists on minimalist design in favor of data precision without unnecessary details and is common for scientific researches and ana

Pictorial Chart

You want design Pictorial Chart or Infographic? And you need powerful infographic software? Then ConceptDraw DIAGRAM diagramming and vector drawing software extended with Pictorial Infographics Solution from the “Infographics” Area is exactly what you need.

Best Flowcharts

Flowcharts visualize a process or algorithm of program as step/operation blocks of various shapes connected with arrowed lines showed the process flow direction. They are used to visualize business or technical processes and software algorithms.

Conceptdraw DIAGRAM - feature-rich flowchart software. It will allow you to create professional looking flowcharts.

table seating chart template, seating charts template, template for seating chart, the seating arrangement, seating arrangement chart, seat plan, seating chart templates? Seating Plans

table seating chart template, seating charts template, template for seating chart, the seating arrangement, seating arrangement chart, seat plan, seating chart templates?
The Seating Plans solution including samples, seating chart templates and libraries of vector design elements assists in creating the Seating plans, Seating arrangement charts, Chair layout designs, Plan drawings of cinema seating, Movie theater chair plans, extensive Cinema theater plans depicting the seating arrangement in the cinema halls, location of closet, cafe and food sale area, in designing the Seating plans for the large seating areas, Seat plan designs for airplanes, trains, etc. Use any of the included samples as the table seating chart template or seating chart template free and achieve professional drawing results in a few minutes.

network layout, network floor plan, network visualization, network topologies, network topology mapper Network Layout Floor Plans

network layout, network floor plan, network visualization, network topologies, network topology mapper
Network Layout Floor Plans solution extends ConceptDraw DIAGRAM software functionality with powerful tools for quick and efficient documentation the network equipment and displaying its location on the professionally designed Network Layout Floor Plans. Never before creation of Network Layout Floor Plans, Network Communication Plans, Network Topologies Plans and Network Topology Maps was not so easy, convenient and fast as with predesigned templates, samples, examples and comprehensive set of vector design elements included to the Network Layout Floor Plans solution. All listed types of plans will be a good support for the future correct cabling and installation of network equipment.

Typography Font

How to create an infographic and make it successful and professional looking? It is a complex process with great quantity of important moments that you should consider. Design and Typography Font play the significant role in the success of typography graphic.
Typography Font makes your Typography Infographic unique and attractive. ConceptDraw DIAGRAM extended with Typography Infographics Solution from the “Infographics” Area provides you the useful tools for simple and quick designing various Typography Infographics.