The vector stencils library "Travel and tourism pictograms" contains 20 travelling and journey symbols.
Use it to draw your tour and trip infograms. The example "Travel and tourism pictograms - Vector stencils library" was created using the ConceptDraw PRO diagramming and vector drawing software extended with the Pictorial infographics solution from the area "What is infographics" in ConceptDraw Solution Park.
Use it to draw your tour and trip infograms. The example "Travel and tourism pictograms - Vector stencils library" was created using the ConceptDraw PRO diagramming and vector drawing software extended with the Pictorial infographics solution from the area "What is infographics" in ConceptDraw Solution Park.
Globe

Wind rose

Direction

Sign
Milestone

Flag

Campground

Tent

RV

Restaurant

Restrooms

Passport

Plane

Ticket

Briefcase

Case

Luggage

Mountains

Palm

Hotel

The vector stencils library "Travel and tourism pictograms" contains 20 travelling and journey symbols.
Use it to draw your tour and trip infograms. The example "Travel and tourism pictograms - Vector stencils library" was created using the ConceptDraw PRO diagramming and vector drawing software extended with the Pictorial infographics solution from the area "What is infographics" in ConceptDraw Solution Park.
Use it to draw your tour and trip infograms. The example "Travel and tourism pictograms - Vector stencils library" was created using the ConceptDraw PRO diagramming and vector drawing software extended with the Pictorial infographics solution from the area "What is infographics" in ConceptDraw Solution Park.
Globe
Wind rose
Direction
Sign
Milestone
Flag
Campground
Tent
RV
Restaurant
Restrooms
Passport
Plane
Ticket
Briefcase
Case
Luggage
Mountains
Palm
Hotel
The vector stencils library "Transport map" contains 96 pictograms for drawing transport maps.
Use it in your spatial infographics for visual representation of transport schemes and plans as metro maps in the ConceptDraw PRO diagramming and vector drawing software extended with the Spatial Infographics solution from the area "What is Infographics" of ConceptDraw Solution Park.
Use it in your spatial infographics for visual representation of transport schemes and plans as metro maps in the ConceptDraw PRO diagramming and vector drawing software extended with the Spatial Infographics solution from the area "What is Infographics" of ConceptDraw Solution Park.
Train Railway

Bus Stop

Tramlink

Marina/Ferry Dock

Information Center

Information Center

Airport

Airport

Underground/Subway/Metro

Underground/Subway/Metro

National Rail Train Station

Taxi

Taxi

Parking

Parking

Parking

Parking

Bicycle Parking

Bicycle Parking

Fuel/Gas/Petrol

Fuel/Gas/Petrol

Police

Police

Hospital

Hospital

Wheelchair Access

Wheelchair Access

First Aid

First Aid

Telephone

Telephone

Post Office

Post Office

Landmarks and Museums

Landmarks and Museums

University

University

Shopping/Supermarket

Shopping/Supermarket

Cafe

Cafe

Food and Drinks

Food and Drinks

Man

Woman

Restrooms/Toilets

Restrooms/Toilets

Park

Park

Zoo

Zoo

Hotel

Hotel

Camping

Camping

City

Skyscraper

Building

Ocean

Straight River

Flexible River

Bridge

North Arrow
Viewpoint

Scale

Road line

Road rounded line

Road corner

Road curve 1

Road curve 2

Crossroads

Roundabout

Cloverleaf interchange

Roadway break

Railway line

Railway curve

Railway fork

Standard line with standard station - basic road

Thick line with standard station - basic road

Standard line with rectangular station - basic road

Thick line with rectangular station - basic road

Standard line with standard station - double road

Thick line with standard station - double road

Standard line with rectangular station - double road

Thick line with rectangular station - double road

Standard line with standard station - dotted road

Thick line with standard station - dotted road

Standard line with rectangular station - dotted road

Thick line with rectangular station - dotted road

Interchange Station Vertical

Interchange Station Horizontal

Transfer Station 1

Transfer Station 2

Transfer Station 3

Line Notation

Street direction

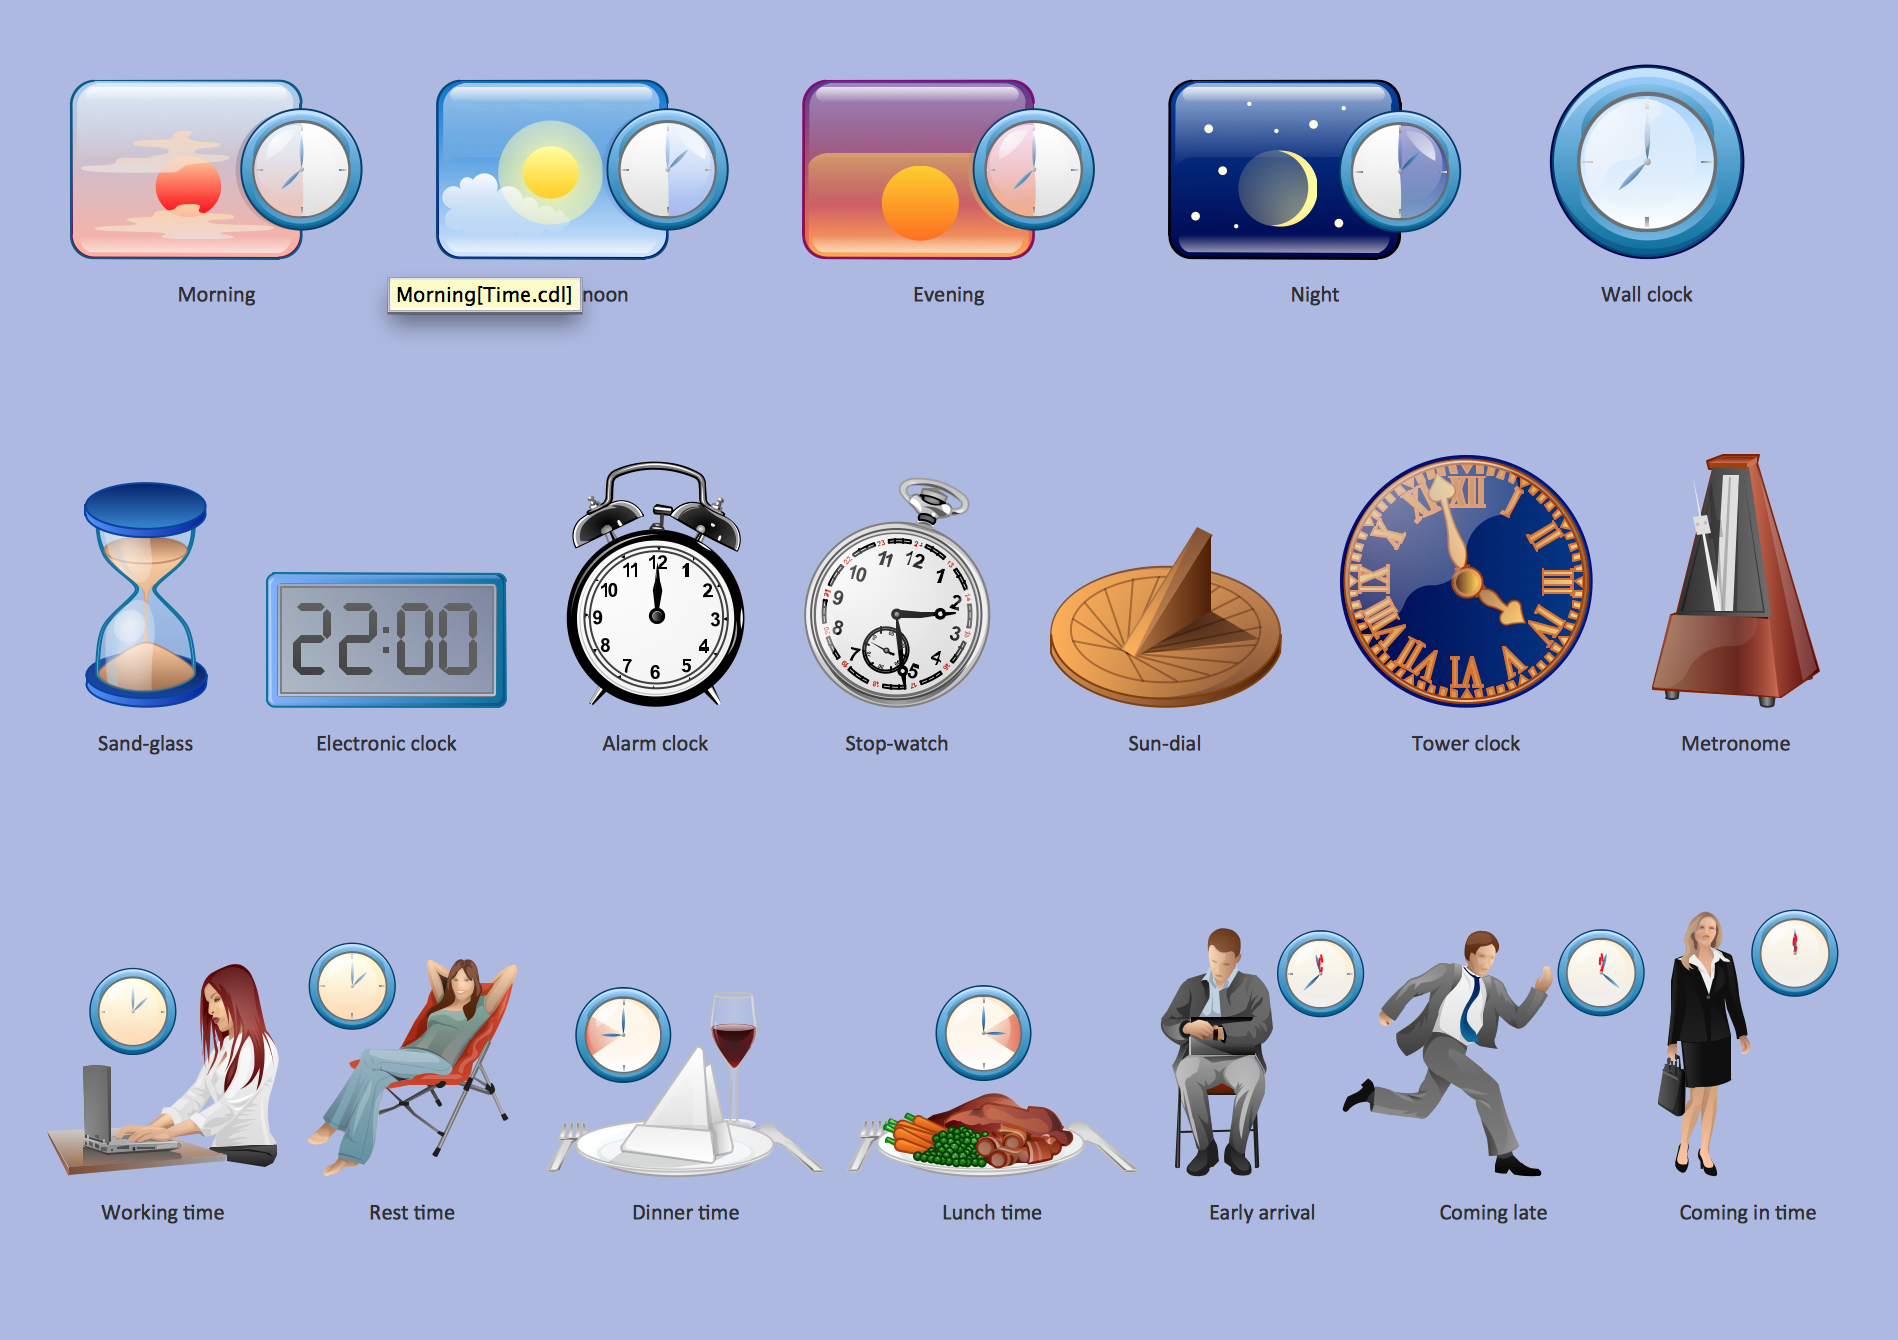
Time - Design Elements
The vector stencils library "Travel and tourism pictograms" contains 20 travelling and journey symbols.
Use it to draw your tour and trip infograms. The example "Travel and tourism pictograms - Vector stencils library" was created using the ConceptDraw PRO diagramming and vector drawing software extended with the Pictorial infographics solution from the area "What is infographics" in ConceptDraw Solution Park.
Use it to draw your tour and trip infograms. The example "Travel and tourism pictograms - Vector stencils library" was created using the ConceptDraw PRO diagramming and vector drawing software extended with the Pictorial infographics solution from the area "What is infographics" in ConceptDraw Solution Park.
Globe
Wind rose
Direction
Sign
Milestone
Flag
Campground
Tent
RV
Restaurant
Restrooms
Passport
Plane
Ticket
Briefcase
Case
Luggage
Mountains
Palm
Hotel
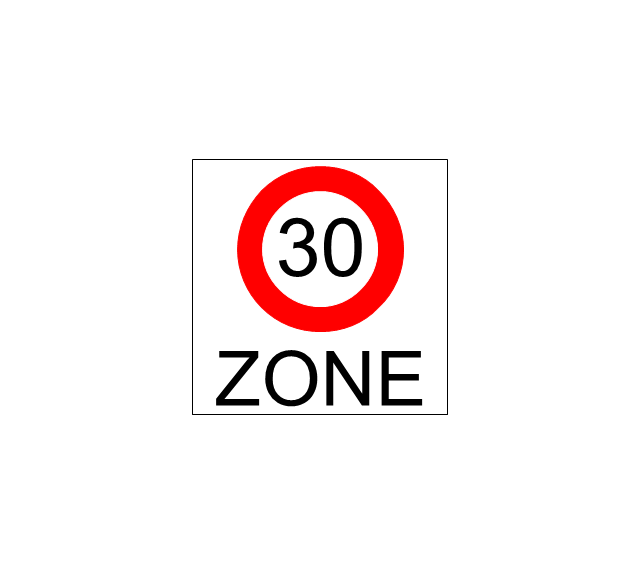
The vector stencils library "Road signs" contains 58 symbols of road signs for labeling the road and route maps, directional and transit maps, street and locator maps.
"Traffic signs or road signs are signs erected at the side of or above roads to give instructions or provide information to road users.
... many countries have adopted pictorial signs or otherwise simplified and standardized their signs to overcome language barriers, and enhance traffic safety. Such pictorial signs use symbols (often silhouettes) in place of words and are usually based on international protocols. Such signs were first developed in Europe, and have been adopted by most countries to varying degrees." [Traffic sign. Wikipedia]
The pictograms example "Road signs - Vector stencils library" was created using the ConceptDraw PRO diagramming and vector drawing software extended with the Directional Maps solution from the Maps area of ConceptDraw Solution Park.
www.conceptdraw.com/ solution-park/ maps-directional
Danger place

Intersection
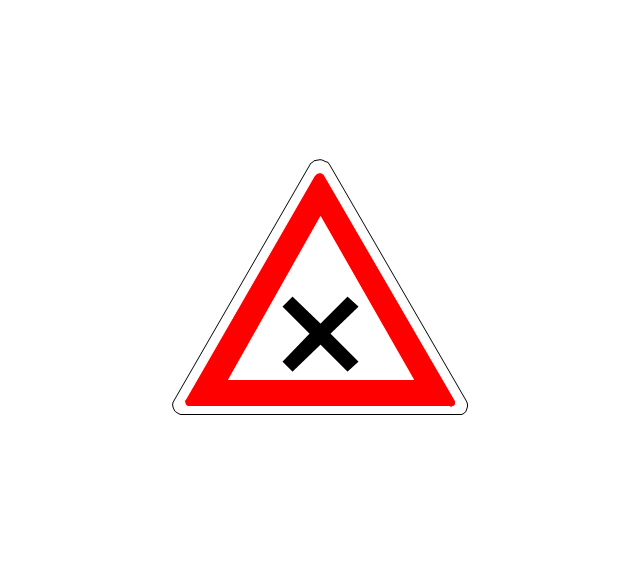
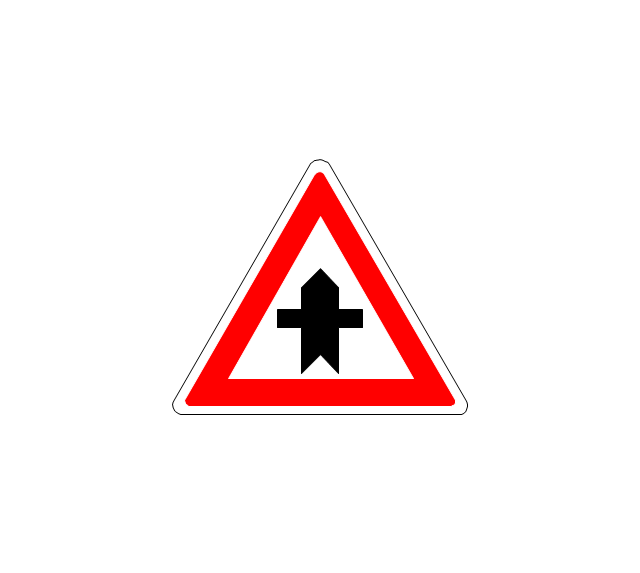
Intersection 2
Bend
Double bend
Two-way traffic
Mobile bridge
Light signal
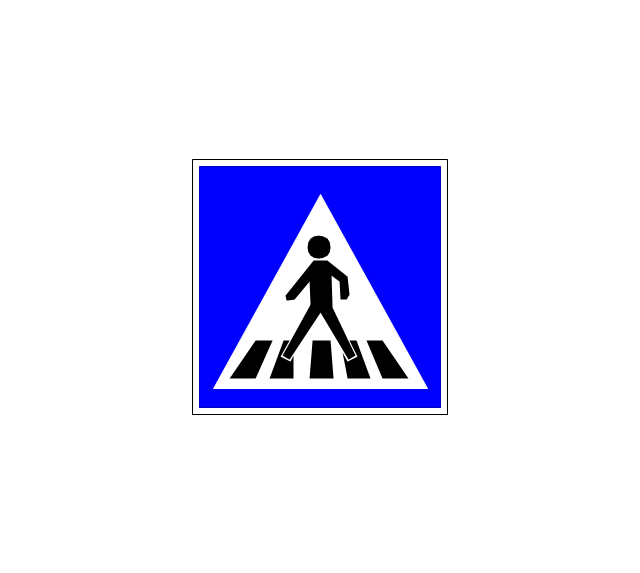
Pedestrian crossing
Road work
Back-up
Give way
Crossing
Stop

Roundabout
Pass this side
Direction to be followed

One-way street
Cycle track
No entry

No entry both directions

No power vehicles
No U-turns
No passing without stopping
No standing and parking
No parking
Speed limit
Height limit
Width limit
Weight limit
Priority over oncoming traffic

Streetcar or regular buses

Taxi status
Beginning that speed 30-Zone
End that speed 30-Zone

Pedestrian crossing 2
Police
Hotel
Breakdown service
Restaurant
P + R
Restroom
Fuel
Telephone

Recommended speed
Nodal point of a motorwa
Parking
Dead end
Motorway
End motorway
Populated zone
End populated zone
Parking with clock
Number sign (motorway)
-road-signs---vector-stencils-library.png--diagram-flowchart-example.png)
Exit
Direction to place
Board of announcement of exit
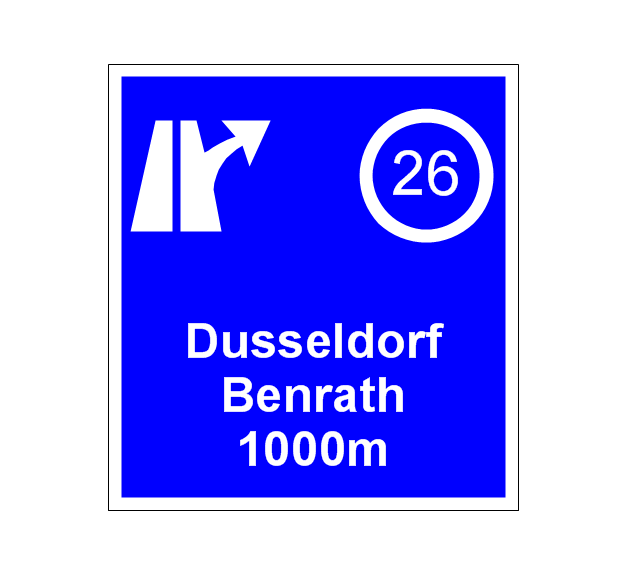
Number sign (federal highway)
-road-signs---vector-stencils-library.png--diagram-flowchart-example.png)
Sales Process Management

It is effective to use professional software for the sales process management. ConceptDraw DIAGRAM diagramming and vector drawing software extended with Sales Flowcharts solution from the Marketing area of ConceptDraw Solution Park is the best choice.
 Floor Plans
Construction, repair and remodeling of the home, flat, office, or any other building or premise begins with the development of detailed building plan and floor plans. Correct and quick visualization of the building ideas is important for further construction of any building.
Design Pictorial Infographics. Design Infographics

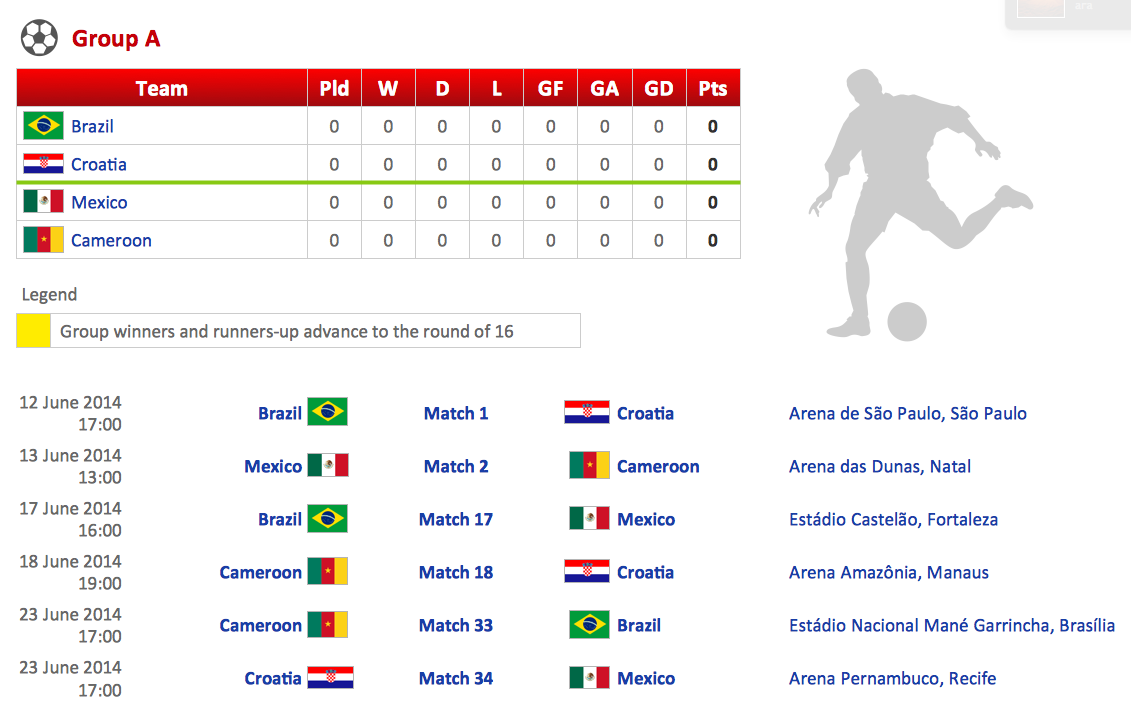
Football – 2014 FIFA World Cup Standings Group
 Site Plans
The Site Plans solution extends ConceptDraw DIAGRAM with samples, templates and numerous libraries of design elements making it powerful site plan software, ideal for landscape drawing, designing Site Plans, Site Layout Plans, Landscape Design Drawings, Home Site Plans, Hotel Site Plans, Park Site Plans, for developing the residential and commercial landscape design drawings and site plan, parks planning, landscaping territories, lighting trails, for creating drainage facilities, yard layouts, plant maps, outdoor recreational facilities, and irrigation systems plans.
 Basic Floor Plans
Detailed floor plan is the basis of any building project, whether a home, office, business center, restaurant, shop store, or any other building or premise. Basic Floor Plans solution is a perfect tool to visualize your creative projects, architectural and floor plans ideas.
 Sales Flowcharts
The Sales Flowcharts solution lets you create and display sales process maps, sales process workflows, sales steps, the sales process, and anything else involving sales process management.
Data Flow Diagram

The vector stencils library "Travel and tourism pictograms" contains 20 travel and tourism pictograms.
Use it to create your infographics, illustrations and presentations.
The pictogram example "Design elements - Travel and tourism pictograms" was created using the ConceptDraw PRO diagramming and vector drawing software extended with the Pictorial infographics solution from the area "What is infographics" in ConceptDraw Solution Park.
Pictograms

- Travel and tourism pictograms - Vector stencils library | Hotel Flight ...
- Pictograms Hotel Restaurant
- How To Draw Plane Of Hotel
- Bobsleigh - Winter sports pictograms | Skeleton Bob Symbol
- Travel and tourism pictograms - Vector stencils library | Travel and ...
- Hotel Network Topology Diagram | Road transport - Vector stencils ...
- Travel and tourism pictograms - Vector stencils library
- Travel and tourism pictograms - Vector stencils library | Travel and ...
- Hotel Plane Icon
- Travel Hotel Png
- Travel and tourism pictograms - Vector stencils library | Travel and ...
- Travel and tourism pictograms - Vector stencils library | Travel and ...
- Travel and tourism pictograms - Vector stencils library | Design ...
- Travel and tourism pictograms - Vector stencils library | Road ...
- Design elements - Travel and tourism pictograms | Travel and ...
- Hotel locator map | Road signs - Vector stencils library | Directional ...
- Travel and tourism pictograms - Vector stencils library | Electrical ...
- Travel and tourism pictograms - Vector stencils library | Event-driven ...
- Travel and tourism pictograms - Vector stencils library | Design ...
- Travel and tourism pictograms - Vector stencils library | Design ...