Program Evaluation and Review Technique (PERT) with ConceptDraw DIAGRAM
Program Evaluation and Review Technique (abbr. PERT) is a method developed by Ministry of Defense of the USA in 1958 for the project of creation the missile system Polaris. PERT diagram is one of the tools for project management that lets greatly simplify the planning and scheduling of large and complex projects. PERT diagram provides evaluation of project run-time and labor forces, it helps to analyze the time necessary for execution each of project tasks and the whole project, and to calculate the project critical path. PERT chart depicts the set of tasks connected each other in order of their execution and is constructed according to one of definite rules - AOA (activity on arrow) or AON (activity on node). It doesn't give you ready concrete decisions, but helps to find them. Design easy the PERT diagrams in ConceptDraw DIAGRAM software enhanced with Seven Management and Planning Tools solution from Management area of ConceptDraw Solution Park. You have a possibility to build the PERT chart of any type, but AON variant is easier for building and perception.PERT Chart
The program (or project) evaluation and review technique, commonly abbreviated PERT, is a statistical tool, used in project management, which was designed to analyze and represent the tasks involved in completing a given project. ConceptDraw DIAGRAM diagramming and vector drawing software extended with Seven Management and Planning Tools Solution from the Management Area offers the extensive drawing tools for effective drawing the PERT Chart of any complexity.PERT Chart Software
PERT Chart Software - Activity Network and Project Evaluation and Review Technique, or PERT, charts are a way of documenting and analyzing the tasks in a project. ConceptDraw DIAGRAM is a powerful diagramming and vector drawing software for designing professional looking PERT Charts quick and easy.Activity Network Diagram Method
Activity Network Diagram - This sample was created in ConceptDraw DIAGRAM diagramming and vector drawing software using the Seven Management and Planning Tools solution from the Management area of ConceptDraw Solution Park. This sample shows the PERT (Program Evaluation Review Technique) chart of the request on proposal. A request for proposal (RFP) is a request of the company or the organization to potential suppliers to submit the business proposals for service or goods that it is interested to purchase. The RFP is represented on the initial procurement stage and allows to define the risks and benefits.Flowchart Examples
It’s very simple, convenient and quick to design professional looking Flowcharts of any complexity using the ConceptDraw DIAGRAM diagramming and vector drawing software extended with Flowcharts Solution from the "Diagrams" Area of ConceptDraw Solution Park which provides a wide set of predesigned objects, templates, samples and Flowchart examples.Activity Network (PERT) Chart
Activity Network and Project Evaluation and Review Technique, or PERT, charts are a way of documenting and analyzing the tasks in a project. This diagram is constructed as part of the process in creating a schedule of corrective actions. The Activity Network Chart (PERT) shows the logical connections and consequence of tasks to be performed. It displays the time period for problem solving and the implementation of all activities through the critical path.UML Class Diagram Example - Buildings and Rooms
This sample was created in ConceptDraw DIAGRAM diagramming and vector drawing software using the UML Class Diagram library of the Rapid UML Solution from the Software Development area of ConceptDraw Solution Park. This sample shows the structure of the building and can be used by building companies, real estate agencies, at the buying / selling of the realty.Activity on Node Network Diagramming Tool
Activity on Node Network Diagramming Tool — Activity Network and Project Evaluation and Review Technique, or PERT, charts are a way of documenting and analyzing the tasks in a project. This sample shows the Activity on node network diagramming method. It was created in ConceptDraw DIAGRAM diagramming and vector drawing software using the Seven Management and Planning Tools solution from the Management area of ConceptDraw Solution Park.Venn Diagram Examples for Problem Solving. Venn Diagram as a Truth Table
Venn diagrams are illustrations used in the branch of mathematics known as set theory. They show the mathematical or logical relationship between different groups of things (sets). A Venn diagram shows all the possible logical relations between the sets.
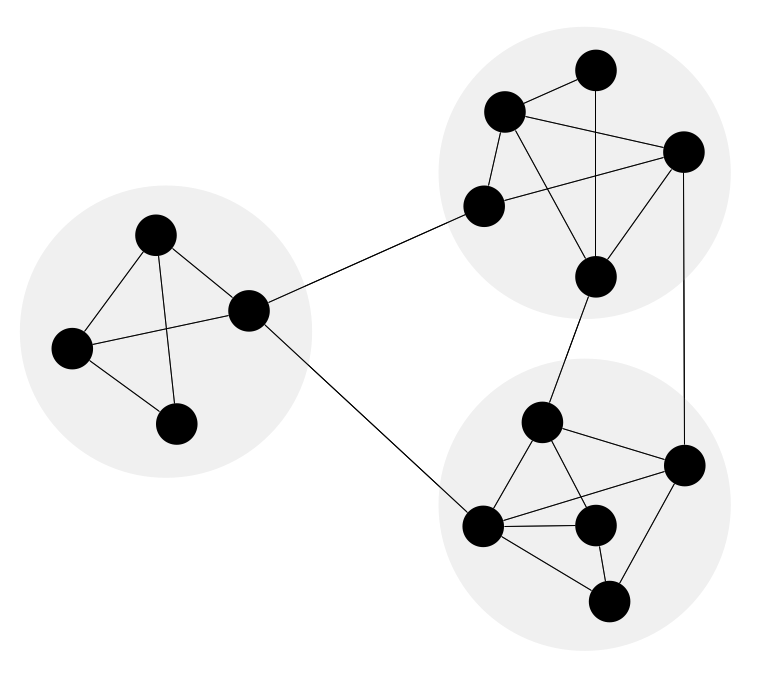
Network Community Structure. Computer and Network Examples
Network community structure is a network which nodes can be easily grouped into the sets of nodes with dense internally connections. This example shows a network that displays the community structure with three groups of nodes with dense internal connections and sparser connections between the groups.
- How To Create a PERT Chart | Pert Example With Solution
- Pert Example Problem And Solution
- Pert Method Example And Solutions
- Product Overview | Pert Cpm Example Problems With Solution
- PERT chart - Sale problem solution | Solution Selling Example
- Pert Chart Project Examples
- Pert Chart Example Problem
- Product Overview | Pert Cpm Network Diagram Examples Solved
- Project — Working With Costs | Best Example Of Pert Cpm In ...
- PERT Chart | Activity Network Diagram Method | Critical Path ...