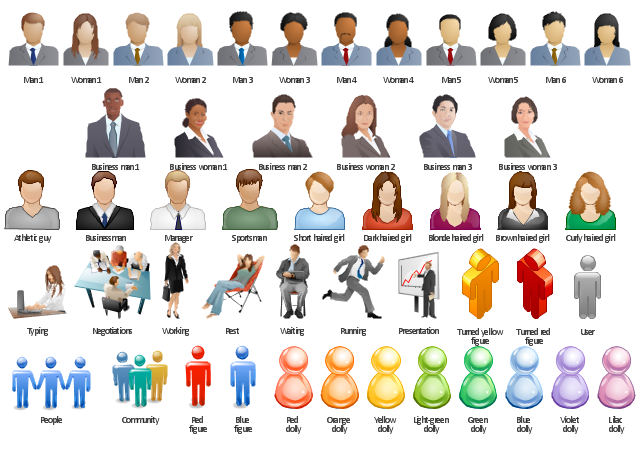
The vector clip art library People contains 49 images and pictograms of men and women you can use to draw your illustrations using the ConceptDraw PRO diagramming and vector drawing software.
"Clip art, in the graphic arts, refers to pre-made images used to illustrate any medium. Today, clip art is used extensively in both personal and commercial projects, ranging from home-printed greeting cards to commercial candles. Clip art comes in many forms, both electronic and printed. However, most clip art today is created, distributed, and used in an electronic form." [Clip art. Wikipedia]
"A pictogram, also called a pictogramme, pictograph, or simply picto, and also an 'icon', is an ideogram that conveys its meaning through its pictorial resemblance to a physical object. Pictographs are often used in writing and graphic systems in which the characters are to a considerable extent pictorial in appearance.
Pictography is a form of writing which uses representational, pictorial drawings, similarly to cuneiform and, to some extent, hieroglyphic writing, which also uses drawings as phonetic letters or determinative rhymes. In certain modern use, pictograms participate to a formal language..." [Pictogram. Wikipedia]
The vector stencils library People is included in the People solution from the Illustration area of ConceptDraw Solution Park.
Vector clip art
Design Pictorial Infographics. Design Infographics

HR Flowchart Symbols

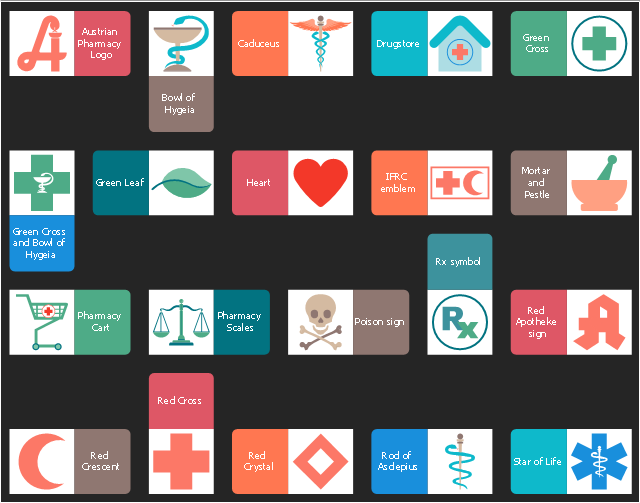
This infographic sample shows pharmacy symbols and medicine pictograms.
"A symbol is a mark, sign, or word that indicates, signifies, or is understood as representing an idea, object, or relationship. Symbols allow people to go beyond what is known or seen by creating linkages between otherwise very different concepts and experiences. All communication (and data processing) is achieved through the use of symbols. Symbols take the form of words, sounds, gestures, ideas or visual images and are used to convey other ideas and beliefs." [Symbol. Wikipedia]
"A pictogram, also called a pictogramme, pictograph, or simply picto, and in computer usage an icon, is an ideogram that conveys its meaning through its pictorial resemblance to a physical object." [Pictogram. Wikipedia]
The healthcare infographic example "Pharmacy symbols" was designed using ConceptDraw PRO software extended with Pharmacy Illustrations solution from Health area of ConceptDraw Solution Park.
Infographic example
Infographic Maker

Venn Diagram

 Basic Picture Graphs
This solution extends the capabilities of ConceptDraw DIAGRAM (or later) with templates, samples and a library of vector stencils for drawing Picture Graphs.
 Winter Sports
The Winter Sports solution from Sport area of ConceptDraw Solution Park contains winter sports illustration examples, templates and vector clipart libraries.
- Pictograph People
- Pictograph
- Trolley Pictograph
- Pictograph Business
- Vector clipart - People | Design elements - Picture graphs ...
- People - Vector stencils library | Professions - Vector stencils library ...
- Design elements - People | Design elements - Marketing pictograms ...
- Pictograph Tourism
- Picture Graph Or Pictograph
- Design elements - People | Design elements - IVR Internet | Design ...