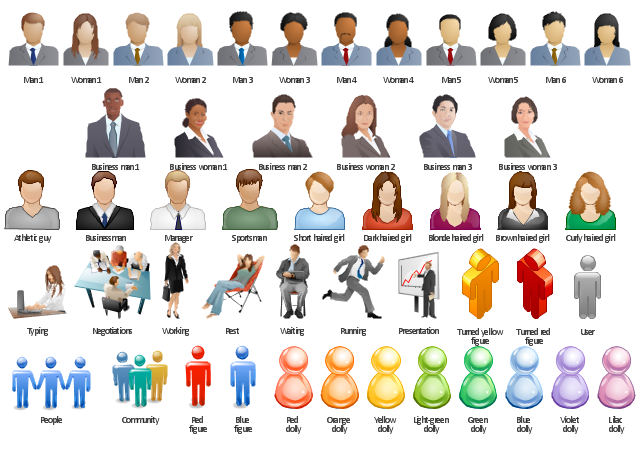
The vector clip art library People contains 49 images and pictograms of men and women you can use to draw your illustrations using the ConceptDraw PRO diagramming and vector drawing software.
"Clip art, in the graphic arts, refers to pre-made images used to illustrate any medium. Today, clip art is used extensively in both personal and commercial projects, ranging from home-printed greeting cards to commercial candles. Clip art comes in many forms, both electronic and printed. However, most clip art today is created, distributed, and used in an electronic form." [Clip art. Wikipedia]
"A pictogram, also called a pictogramme, pictograph, or simply picto, and also an 'icon', is an ideogram that conveys its meaning through its pictorial resemblance to a physical object. Pictographs are often used in writing and graphic systems in which the characters are to a considerable extent pictorial in appearance.
Pictography is a form of writing which uses representational, pictorial drawings, similarly to cuneiform and, to some extent, hieroglyphic writing, which also uses drawings as phonetic letters or determinative rhymes. In certain modern use, pictograms participate to a formal language..." [Pictogram. Wikipedia]
The vector stencils library People is included in the People solution from the Illustration area of ConceptDraw Solution Park.
Vector clip art
Design Pictorial Infographics. Design Infographics

- Design elements - People | Pictograph Women
- Vector clipart - People | Design elements - Picture graphs ...
- Design elements - Management pictograms | Design elements ...
- People pictograms - Vector stencils library | People pictograms ...
- Design elements - Marketing pictograms | Design elements - People ...
- Pictogram People
- Business Pictograph Graphs
- Design elements - People | Landscape Architecture with ...
- Design elements - People
- Business people pictograms - Vector stencils library | Design ...
- Design elements - People | People - Vector stencils library | Design ...
- Manager Pictogram Design
- Design Pictorial Infographics. Design Infographics | Pictograph Of ...
- Design elements - Picture graphs | Pictograph
- Business People Clipart | Business and Finance Illustrations ...
- Design elements - People | Audio, Video, Media | Geo Map - Asia ...
- People - Vector stencils library | Professions - Vector stencils library ...
- Design elements - Scrum people | Design elements - Cisco people ...
- People pictograms - Vector stencils library | Design elements ...
- Design elements - Marketing pictograms | Design elements - IVR ...