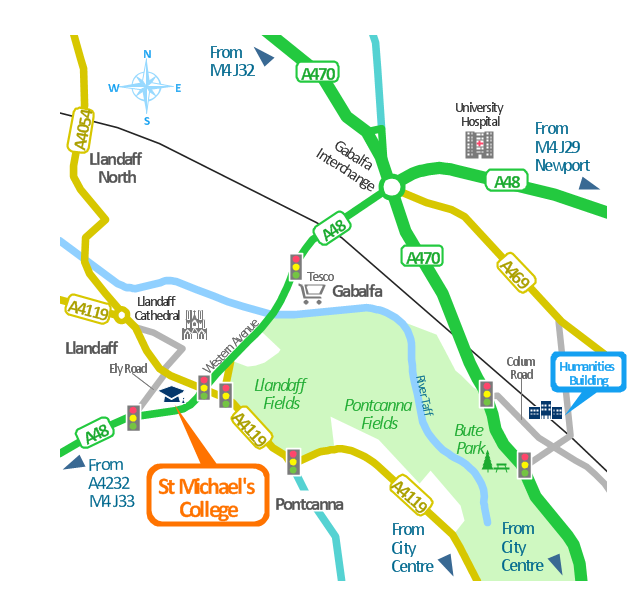
This spatial infographics was created on the bese of the conference centre location map from the website. [cf.ac.uk/ share/ research/ centres/ clarc/ newsandevents/ isns-conference-2013-booking-information.html]
"The terms location and place in geography are used to identify a point or an area on the Earth's surface or elsewhere. The term location generally implies a higher degree of certainty than place, which often indicates an entity with an ambiguous boundary, relying more on human/ social attributes of place identity and sense of place than on geometry.
Types of location/ place.
(1) A relative location is described as a displacement from another site...
(2) A locality is likely to have a well-defined name but a boundary which is less well defined and which varies by context." [Location (geography). Wikipedia]
The spatial infographics example "Conference centre location map" was created using the ConceptDraw PRO diagramming and vector drawing software extended with the Spatial Infographics solution from the area "What is Infographics" of ConceptDraw Solution Park.
Spatial infographics
The vector stencils library "Landmarks" contains 34 landmark symbols.
Use it to mark maps for spatial infographics in the ConceptDraw PRO diagramming and vector drawing software extended with the Spatial Infographics solution from the area "What is Infographics" of ConceptDraw Solution Park.
Use it to mark maps for spatial infographics in the ConceptDraw PRO diagramming and vector drawing software extended with the Spatial Infographics solution from the area "What is Infographics" of ConceptDraw Solution Park.
Airport

Skyscraper

City

Building 1

Building 2

House 1

House 2

Factory

Petrol Station

Fire Station

Hospital

Town Hall

Cathedral

Shopping Centre

Convenience Store

Park

Traffic Light

Bus 1

Bus 2

Tram 1

Tram 2

Train

Train/Tram

Car 1

Car 2

Car 3

Bicycle

Ferry/Boat

Airplane

Funicular

Ropeway/Cableway

River

Lake

Stadium
 Active Directory Diagrams
Active Directory Diagrams solution extends ConceptDraw PRO software with samples, templates and libraries of vector stencils for drawing the AD diagrams to visualize the detail structures of the Microsoft Windows networks.
 Composition Dashboard
Composition dashboard solution extends ConceptDraw PRO software with templates, samples and vector stencils library with charts and indicators for drawing visual dashboards showing data composition.
 Telecommunication Network Diagrams
Telecommunication Network Diagrams solution extends ConceptDraw PRO software with samples, templates and libraries of vector stencils for drawing the diagrams of telecommunication networks.
Map Infographic Design

Design Pictorial Infographics. Design Infographics

 Status Dashboard
Status dashboard solution extends ConceptDraw PRO software with templates, samples and vector stencils libraries with graphic indicators for drawing the visual dashboards showing status data.
 Vehicular Networking
Network engineering is an extensive area with wide range of applications. Depending to the field of application, network engineers design and realize small networks or complex networks, which cover wide territories. In latter case will be ideal recourse to specialized drawing software, such as ConceptDraw PRO.
How to draw Metro Map style infographics? (London)

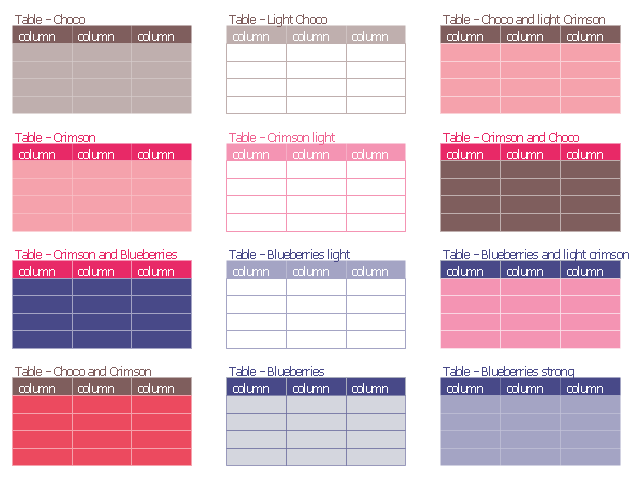
The vector stencils library "Tables" contains 12 table blocks. Use it to add typography elements into your infographics.
"A table is a means of arranging data in rows and columns. The use of tables is pervasive throughout all communication, research and data analysis. Tables appear in print media, handwritten notes, computer software, architectural ornamentation, traffic signs and many other places. The precise conventions and terminology for describing tables varies depending on the context. Further, tables differ significantly in variety, structure, flexibility, notation, representation and use. In books and technical articles, tables are typically presented apart from the main text in numbered and captioned floating blocks." [Table (information). Wikipedia]
The example "Design elements - Tables" was created using the ConceptDraw PRO diagramming and vector drawing software extended with the Typography Infographics solition from the area "What is infographics" in ConceptDraw Solution Park.
Typography infographics elements - Tables
 Aerospace and Transport
This solution extends ConceptDraw PRO software with templates, samples and library of vector clipart for drawing the Aerospace and Transport Illustrations. It contains clipart of aerospace objects and transportation vehicles, office buildings and anci
Spatial Data Analysis

Road Transport - Design Elements

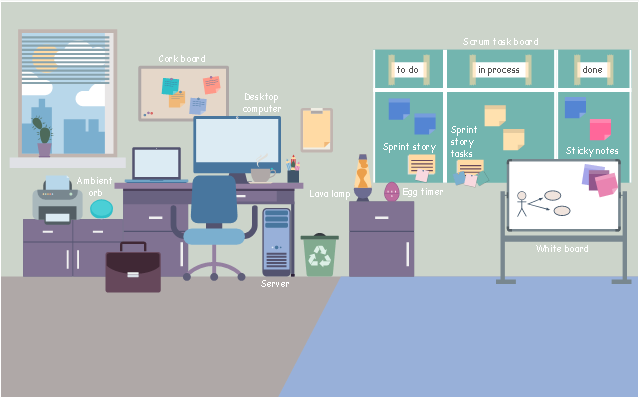
This agile software development infographic example was inspired by Mike Cohn's post "The Ideal Agile Workspace" from the Mountain Goat Software blog.
"... a list of all the things that ... should be visible within the ideal agile workspace:
* Big Visible Charts. ... the sprint burndown chart, showing the number of hours remaining as of each day of the current sprint. ... big visible charts showing the number of passing customer acceptance tests, the pass/ fail status of tests by day, sprint and release burndown charts, number of new stories introduced to the product backlog per sprint ...
* Additional feedback devices. ... a lava lamp that is turned on whenever the automated build is broken. ... flashing red traffic lights to indicate exceptional conditions such as an issue on a production server. ... ambient orbs and Nabaztag rabbits, which are wireless programmable devices that can also be configured to change colors, speak messages, or wiggle their ears as a team desires.
* Everyone on your team. Each person on the team should ideally be able to see each other person on the team. ...
* The sprint backlog. ... The best way to do that is by displaying the sprint backlog on a wall, ideally in the form of a task board A task board is usually oriented in rows and columns with each row containing a particular user story and one index card or sticky note for each task involved in that story. Task cards are organized in columns, minimally including “To Do” “In Process,” and “Done.” ...
* The product backlog. ... tack the index cards with those upcoming user stories on a wall where all can see them. ...
* At least one big white board. ...
* Someplace quiet and private. ...
* Food and drink. ...
* A window." [mountaingoatsoftware.com/ blog/ the-ideal-agile-workspace].
The infographic sample "Scrum workspace" was created using the ConceptDraw PRO software extended with the Scrum solution from the Project Management area of ConceptDraw Solution Park.
Infographic
- Landmarks - Vector stencils library | Spatial Infographics | Filling ...
- Spatial infographics Design Elements: Location Map | Conference ...
- Visio Traffic Light Stencil
- Car Traffic Png
- Intelligent transportation system | Transportation Infographics | UML ...
- A Symbol Of Traffic Lights On Map
- Animals - Vector stencils library | Infographic Maker | Education ...
- Map Directions | How to draw Metro Map style infographics ? (New ...
- Visualization Spatial Data Using Thematic Maps Combined with ...
- Shopping Online | Design Pictorial Infographics . Design ...
- Map symbols - Vector stencils library | Value Stream Mapping ...
- Design elements - Shopping pictograms | Infographic Software ...
- Design Pictorial Infographics . Design Infographics | Sample Pictorial ...
- Network Security Devices | Map Infographic Design | Interior Design ...
- Design elements - Location map | Landmarks - Vector stencils ...
- City Road Map With Traffic Signals Clipart
- Metro Train Map | Metro Map | How to draw Metro Map style ...
- Simple Traffic Signal With Vehicles Drawings
- Network Security Devices | Access and security - Vector stencils ...
- 3D pictorial street map | Map Infographic Tool | How to Create a ...