This site uses cookies. By continuing to browse the ConceptDraw site you are agreeing to our Use of Site Cookies.

Program Evaluation and Review Technique (PERT) with ConceptDraw DIAGRAM

PERT Diagram is a more realistic approach of a project's time estimate analysis. After PERT chart was constructed user can discover the shortest possible duration for entire project timescale. The project timeline is the longest chain that might be taken with connected tasks on the PERT Diagram. Completion of serial tasks need to be accomplished in a presented order. At a project timeline can be independent tasks that not linked with main sequence they are called parallel tasks. PERT diagram is more suitable for Critical Path Analysis than Gantt chart for the reason that it undoubtedly better determine task dependencies. Project managers customarily utilize both methodologies.
HelpDesk

How to Use Critical Path Analysis for Scheduling Complex Projects

Critical Path Analysis helps you to identify the minimum length of time needed to complete a project. Where you need to run an accelerated project, it helps you to identify which project steps you should accelerate to complete the project within the available time.

How to Discover Critical Path on a Gantt Chart

ConceptDraw PROJECT is the Gantt chart software that implements critical path method to provide the user with a wide set of project management tools.

Critical Path Method in ConceptDraw PROJECT

The Critical Path Method (CPM) is an algorithm for scheduling a set of project activities. It is an important tool for effective project management. ConceptDraw PROJECT implements this method to provide the user with a wide set of project management tools.
HelpDesk

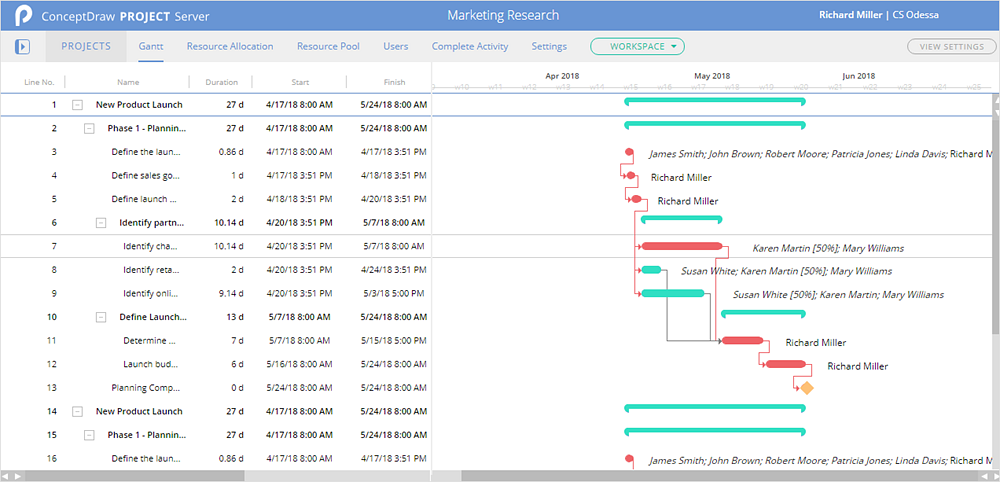
How To Show Critical Path in ConceptDraw PROJECT Server

The critical path in project management means the picked tasks that influence the start and finish date of a project. Changing date of these selected tasks leads to change of the finish date for the entire project. ConceptDraw PROJECT Server offers a set of tools to track your project tasks, including the possibility to highlight the critical path. Thus you can view, how much a date shift in one task will influence on your project date.

How To create Value Stream Map (VSM)

Value Stream Map template helps you to create VSM diagrams using ConceptDraw DIAGRAM software.

Gant Chart in Project Management

Gant Chart is a graphical representation of tasks as segments on a time scale. It helps plan and monitor project development or resource allocation. The horizontal axis is a time scale, expressed either in absolute or relative time.
what is software project management

ConceptDraw PROJECT Project Management Software Tool

ConceptDraw PROJECT is simple project management software. If you are on the fast track in your career and start facing such challenges as coordination many people, coordination tasks and works, manage project with a great deal of time and money involved - it is the right time to get Project management tool involved in your work.

Activity Network (PERT) Chart

Activity Network and Project Evaluation and Review Technique, or PERT, charts are a way of documenting and analyzing the tasks in a project.
This diagram is constructed as part of the process in creating a schedule of corrective actions. The Activity Network Chart (PERT) shows the logical connections and consequence of tasks to be performed. It displays the time period for problem solving and the implementation of all activities through the critical path.

Gantt chart examples

All Gantt charts were made using ConceptDraw PROJECT. ConceptDraw PROJECT works both on Windows and Mac OS X. It allows to schedule a voluntary number of projects in a single Workspace document and lets easily share tasks and resources among them. ConceptDraw PROJECT shares files among Windows and Mac OS X.