Example of DFD for Online Store (Data Flow Diagram) DFD Example


 Funnel Diagrams
Funnel Diagrams solution including wide range of funnel diagram samples, sales funnel examples, and vector design elements, makes the ConceptDraw PRO ideal for funnel management and creation the Funnel Diagrams of different types and designs, AIDA Model, AIDAS, ACCA Dagmar, Rossiter-Percy Model, Sales funnel, Marketing funnel, Search funnel, Brand funnel, Purchase funnel, Lead funnel, Conversion funnel, Business funnel, etc. You are free to choose to place your funnel object horizontally or vertically, you can use the objects with desired quantity of sales funnel stages, as well as to modify their size, color filling, and other parameters to make exceptionally looking Funnel diagrams fully responding to your desires.
UML Use Case Diagram Example Social Networking Sites Project

BPR Diagram. Business Process Reengineering Example

"Online shopping or e-shopping is a form of electronic commerce which allows consumers to directly buy goods or services from a seller over the Internet using a web browser. Alternative names are: e-web-store, e-shop, e-store, Internet shop, web-shop, web-store, online store, online storefront and virtual store. Mobile commerce (or m-commerce) describes purchasing from an online retailer's mobile optimized online site or app.
An online shop evokes the physical analogy of buying products or services at a bricks-and-mortar retailer or shopping center; the process is called business-to-consumer (B2C) online shopping. In the case where a business buys from another business, the process is called business-to-business (B2B) online shopping. The largest of these online retailing corporations are Alibaba, Amazon.com, and eBay. Retail success is no longer all about physical stores. This is evident because of the increase in retailers now offering online store interfaces for consumers. With the growth of online shopping, comes a wealth of new market footprint coverage opportunities for stores that can appropriately cater to offshore market demands and service requirements." [Online shopping. Wikipedia]
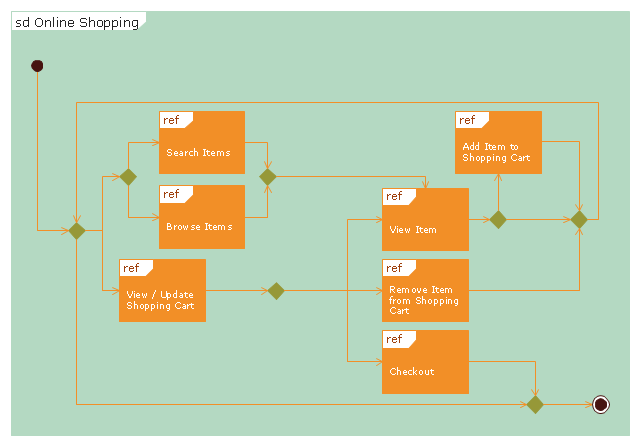
The UML interaction overview diagram example "Online shopping" was created using the ConceptDraw PRO diagramming and vector drawing software extended with the Rapid UML solution from the Software Development area of ConceptDraw Solution Park.
An online shop evokes the physical analogy of buying products or services at a bricks-and-mortar retailer or shopping center; the process is called business-to-consumer (B2C) online shopping. In the case where a business buys from another business, the process is called business-to-business (B2B) online shopping. The largest of these online retailing corporations are Alibaba, Amazon.com, and eBay. Retail success is no longer all about physical stores. This is evident because of the increase in retailers now offering online store interfaces for consumers. With the growth of online shopping, comes a wealth of new market footprint coverage opportunities for stores that can appropriately cater to offshore market demands and service requirements." [Online shopping. Wikipedia]
The UML interaction overview diagram example "Online shopping" was created using the ConceptDraw PRO diagramming and vector drawing software extended with the Rapid UML solution from the Software Development area of ConceptDraw Solution Park.
UML interaction overview diagram
Pyramid Diagram

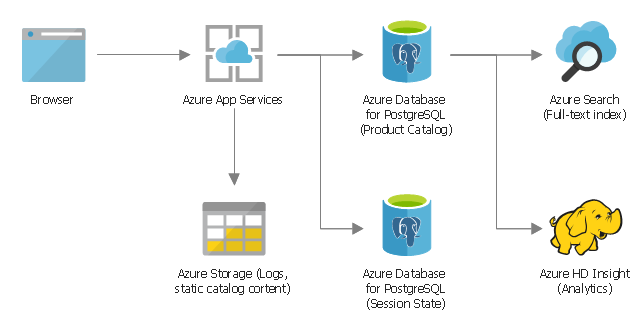
This Azure architecture diagram sample illustrates usage of Azure Database for PostgreSQL in retail and e-commerce solutions.
It was designed on the base of the Azure architecture diagram from the Microsoft Azure website. [azure.microsoft.com/ en-in/ solutions/ architecture/ retail-and-ecommerce-using-azure-database-for-postgresql/ ]
"E-commerce is the activity of buying or selling of products on online services or over the Internet. Electronic commerce draws on technologies such as mobile commerce, electronic funds transfer, supply chain management, Internet marketing, online transaction processing, electronic data interchange (EDI), inventory management systems, and automated data collection systems.
Modern electronic commerce typically uses the World Wide Web for at least one part of the transaction's life cycle although it may also use other technologies such as e-mail." [E-commerce. Wikipedia]
The Azure architecture diagram example "Retail and e-commerce using Azure Database for PostgreSQL" was designed using ConceptDraw PRO software extended with Azure Architecture solution from Computer and Networks area of ConceptDraw Solution Park.
Business Process Flow Diagram

Fishbone Diagram Problem Solving

Marketing Sales Funnel Examples

- UML interaction overview diagram - Online shopping | Diagram Of ...
- Business Process Mapping | SIPOC Diagram | Business Package for ...
- Ecommerce Mobile App Design Dfd
- Flow chart Example. Warehouse Flowchart | UML Use Case ...
- Business Package for Management | Business Process Diagrams ...
- Data Flow Diagram Of E Commerce Website
- UML Use Case Diagram Example Social Networking Sites Project ...
- Example of DFD for Online Store (Data Flow Diagram ) DFD ...
- Connecting Social Media To Ecommerce Diagram