Export from ConceptDraw PRO Document to a Graphic File


This picture bar graph sample shows the computer and Internet use at home from 1984 to 2014. It was designed using data from website of the United States Census Bureau (USCB).
[census.gov/ content/ dam/ Census/ library/ visualizations/ 2016/ comm/ digital_ nation.png]
"Home automation is the residential extension of building automation and involves the control and automation of lighting, heating, ventilation, air conditioning (HVAC), appliances, and security. Modern systems generally consist of switches and sensors connected to a central hub sometimes called a "gateway" from which the system is controlled with a user interface that is interacted either with a wall-mounted terminal, mobile phone software, tablet computer or a web interface." [Home automation. Wikipedia]
The pictorial chart example "Computer and Internet use at home over time" was created using the ConceptDraw PRO diagramming and vector drawing software extended with the Picture Graphs solution from the Graphs and Charts area of ConceptDraw Solution Park.
Image chart

Examples of Flowcharts, Org Charts and More


"Household income is a measure of the combined incomes of all people sharing a particular household or place of residence. It includes every form of income, e.g., salaries and wages, retirement income, near cash government transfers like food stamps, and investment gains.
Average household income can be used as an indicator for the monetary well-being of a country's citizens. Mean or median net household income, after taxes and mandatory contributions, are good indicators of standard of living, because they include only disposable income and acknowledge people sharing accommodation benefit from pooling at least some of their living costs.
Average household incomes need not map directly to measures of an individual's earnings such as per capita income as numbers of people sharing households and numbers of income earners per household can vary significantly between regions and over time." [Household income. Wikipedia]
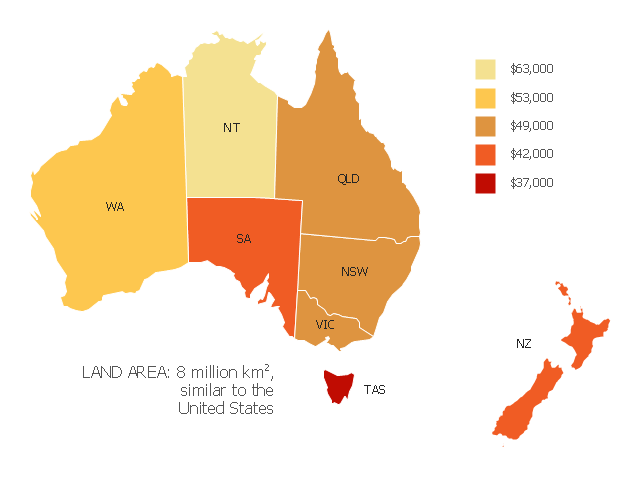
This map example shows 2007 median household incomes in the states and mainland territories of the Commonwealth of Australia.
The thematic map example "Map of median household income in Australia" was redesigned from the Wikimedia Commons file: Map of median household income in Australia.PNG.
[commons.wikimedia.org/ wiki/ File:Map_ of_ median_ household_ income_ in_ Australia.PNG]
The example "Map of median household income in Australia" was created using the ConceptDraw PRO diagramming and vector drawing software extended with the Continent Map solution from the Maps area of ConceptDraw Solution Park.
Average household income can be used as an indicator for the monetary well-being of a country's citizens. Mean or median net household income, after taxes and mandatory contributions, are good indicators of standard of living, because they include only disposable income and acknowledge people sharing accommodation benefit from pooling at least some of their living costs.
Average household incomes need not map directly to measures of an individual's earnings such as per capita income as numbers of people sharing households and numbers of income earners per household can vary significantly between regions and over time." [Household income. Wikipedia]
This map example shows 2007 median household incomes in the states and mainland territories of the Commonwealth of Australia.
The thematic map example "Map of median household income in Australia" was redesigned from the Wikimedia Commons file: Map of median household income in Australia.PNG.
[commons.wikimedia.org/ wiki/ File:Map_ of_ median_ household_ income_ in_ Australia.PNG]
The example "Map of median household income in Australia" was created using the ConceptDraw PRO diagramming and vector drawing software extended with the Continent Map solution from the Maps area of ConceptDraw Solution Park.
Thematic map - Australia
Flow Chart Symbols

Geo Map — Asia

Dashboards. Time Scale. Part I

Business Process Flowchart Symbols

Entity Relationship Diagram Symbols
