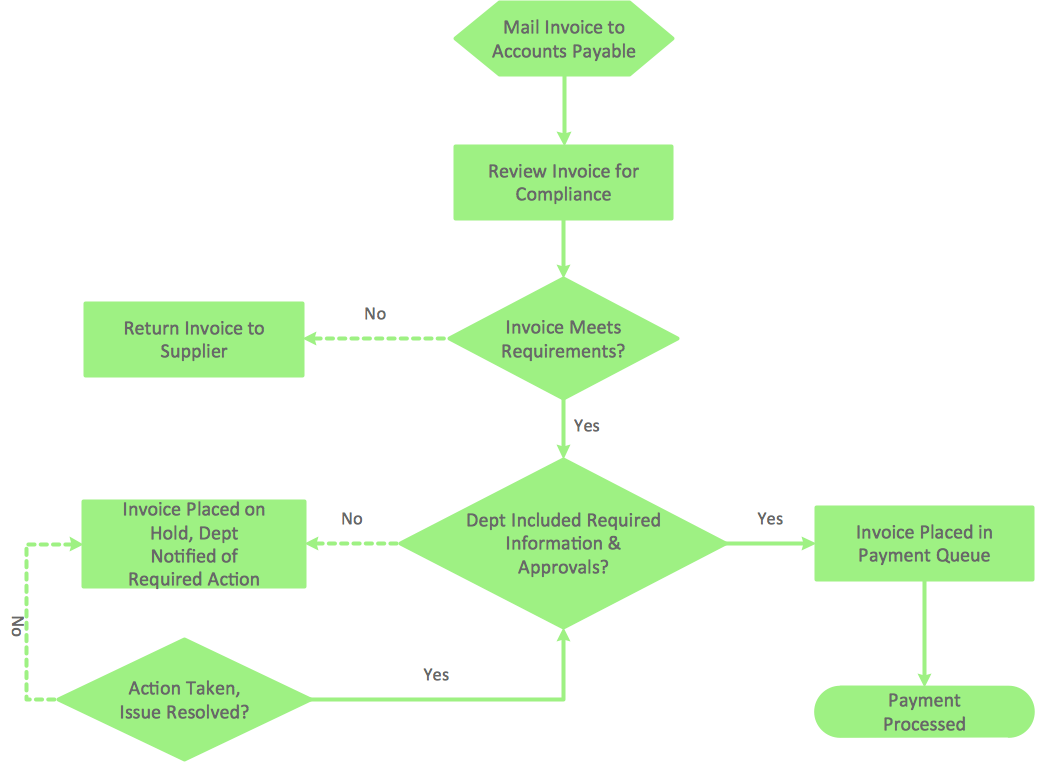
This site uses cookies. By continuing to browse the ConceptDraw site you are agreeing to our Use of Site Cookies.

ER diagram tool for OS X

ER diagram is the most popular database design tool which lets create graphical representations of database tables, their columns and also relationships. As for the Mac users, they are very interested in powerful database diagramming tools and ER diagram tool for OS X to design professional looking E-R Diagrams and ERD drawings. ConceptDraw DIAGRAM software on Mac OS X gives the ability to easy draw ERDs.

Best Vector Drawing Application for Mac OS X

ConceptDraw DIAGRAM creates drawings, diagrams and charts with great visual appeal in Mac OS X.

ConceptDraw DIAGRAM The best Business Drawing Software

ConceptDraw DIAGRAM is new software for business and technical drawing. Powerful business drawing tools, extensive libraries with pre-drawn shapes, free samples of business drawings, technical drawings and flowcharts, support of many graphic formats enable users to visually develop their business drawings charts and diagrams in any combination of drawings, diagrams and flow charts.

Create Flow Chart on Mac

Use ConceptDraw DIAGRAM diagramming and business graphics software to draw your own flowcharts of business processes. Start creating your own Process Flow Diagram with ConceptDraw DIAGRAM and accomplish great results in the moment.
Extended flowchart maker features of Rapid Draw functionality was developed to create flow chart on the Mac OS X platform. You will save time by quick and simple flowchart maker due to Rapid Draw.

Workflow Diagram Software Mac

ConceptDraw DIAGRAM software is the best Mac software for drawing workflow diagrams. Its rich set of samples and templates, and specific features to draw diagrams faster make this software as comfortable as possible for drawing workflow diagrams.
Use the ConceptDraw DIAGRAM professional Mac OS X software for drawing workflow diagram. The Workflow Diagrams solution with its libraries and templates set make the possibility to identify resources that are required for work goal implementation. The process flow diagram identify flow which occurs as network of process dependencies, organizational decisions and interactions between departments. Usually workflow diagrams show business participants actions that carry product or service to the final destination, the consumer.

Best Diagramming Software for macOS

ConceptDraw DIAGRAM creates drawings, flowcharts, block diagrams, bar charts, histograms, pie charts, divided bar diagrams, line graphs, area charts, scatter plots, circular arrows diagrams, Venn diagrams, bubble diagrams with great visual appeal on Mac OS X.
How to Draw a Bubble Chart

Flowchart Program Mac

ConceptDraw software has been developed for drawing any type of flowchart. Use RapidDraw - thi is flowchart maker technology for adding new objects to a flowchart quickly. This is technology of fast drawing technique focused on making great-looking flowcharts quickly. To get started using it download flowchart maker ConceptDraw DIAGRAM.

Entity Relationship Diagram Software Engineering

Entity Relationship Diagram (aka ERD, ER Diagram, E-R Diagram) is a well-tried software engineering tool for data modeling, system design and illustrating the logical structure of databases.
Professional ERD drawing is an essential software engineering method for database modeling. ConceptDraw DIAGRAM as a powerful Entity Relationship Diagram Software Engineering offers the tools of Entity-Relationship Diagram (ERD) solution from Software Development area of ConceptDraw Solution Park.

Cross-Functional Flowchart (Swim Lanes)

ConceptDraw DIAGRAM diagramming software provides vector shapes and connector tools for quick and easy drawing diagrams for business, technology, science and education.
Use flowchart maker of ConceptDraw DIAGRAM enhanced with solutions from ConceptDraw Solution Park to create diagrams to present and explain structures, process flows, logical relationships, networks, design schemes and other visually organized information and knowledge.

Draw Fishbone Diagram on MAC Software

There are many tools to facilitate the problem solving process. Cause and Effect diagram, or Fishbone diagram is one of them. Fishbone diagram can be constructed following 5 simple steps.
Professional diagramming ConceptDraw DIAGRAM MAC OSX software with Fishbone Diagrams solution helps you make cause and effect analysis, identify the possible causes for an effect for problem solving, draw Fishbone diagram on Mac software aka Ishikawa diagram from brainstorm, templates and examples.