Organizational Charts with ConceptDraw PRO

Competitor Analysis

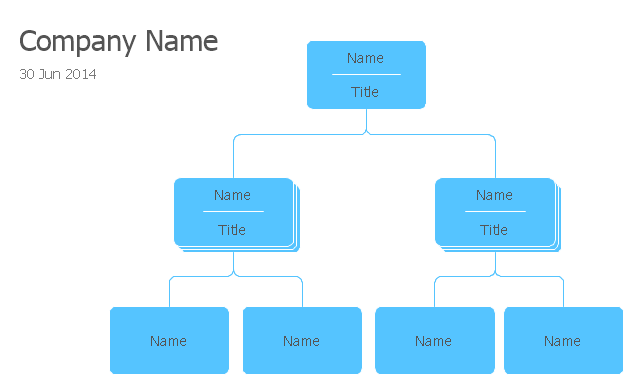
"The organization chart is a diagram showing graphically the relation of one official to another, or others, of a company. It is also used to show the relation of one department to another, or others, or of one function of an organization to another, or others. This chart is valuable in that it enables one to visualize a complete organization, by means of the picture it presents.
A company's organizational chart typically illustrates relations between people within an organization. Such relations might include managers to sub-workers, directors to managing directors, chief executive officer to various departments, and so forth. When an organization chart grows too large it can be split into smaller charts for separate departments within the organization." [Organizational chart. Wikipedia]
This organizational chart template for the ConceptDraw PRO diagramming and vector drawing software is included in the Organizational Charts solution from the Management area of ConceptDraw Solution Park.
Organizational chart template
Organizational Chart Templates


SWOT Analysis

 Ice Hockey
The Ice Hockey Solution extends the capabilities of ConceptDraw PRO v9.5 (or later) with samples, templates, and libraries of vector objects for drawing hockey diagrams, plays schemas, and illustrations. The Ice Hockey Solution can be used to make polishe
Flow chart Example. Warehouse Flowchart


Work Flow Process Chart

Cross-Functional Flowchart


 Timeline Diagrams
Timeline Diagrams solution extends ConceptDraw PRO diagramming software with samples, templates and libraries of specially developed smart vector design elements of timeline bars, time intervals, milestones, events, today marker, legend, and many other elements with custom properties, helpful for professional drawing clear and intuitive Timeline Diagrams. Use it to design simple Timeline Diagrams and designate only the main project stages, or highly detailed Timeline Diagrams depicting all project tasks, subtasks, milestones, deadlines, responsible persons and other description information, ideal for applying in presentations, reports, education materials, and other documentation.
- How to Draw an Organization Chart | Marketing and Sales ...
- Scatter Diagrams | Show The Draw Of Football Field And Identify ...
- How to Make Soccer Position Diagram Using ConceptDraw PRO ...
- Game Company Organization Chart
- Ice Hockey | Ice Hockey Positions Diagram | Ice Hockey Offside ...
- Organisation Chart Showing Is Positions
- Design elements - Education charts | US Navy operating forces - Org ...
- Matrix Organization Structure | Organizational Structure ...
- How to Draw an Organization Chart | Organizational Structure ...
- How to Draw a Flat Organizational Chart with ConceptDraw PRO ...