 25 Typical Orgcharts
The 25 Typical Orgcharts solution contains powerful organizational structure and organizational management drawing tools, a variety of professionally designed organization chart and matrix organization structure samples, 25 templates based on various orga
HelpDesk
How to Create a Time Series Dashboard

HelpDesk
How to Create a Sales Dashboard

Pyramid Diagram and Pyramid Chart

 Interactive Voice Response Diagrams
Interactive Voice Response Diagrams solution extends ConceptDraw DIAGRAM software with samples, templates and libraries of ready-to-use vector stencils that help create Interactive Voice Response (IVR) diagrams illustrating in details a work of interactive voice response system, the IVR system’s logical and physical structure, Voice-over-Internet Protocol (VoIP) diagrams, and Action VoIP diagrams with representing voice actions on them, to visualize how the computers interact with callers through voice recognition and dual-tone multi-frequency signaling (DTMF) keypad inputs.
HelpDesk
How to Connect a Live Object to a Text Data Source

 PM Planning
The PM Planning solution extends the functional abilities of ConceptDraw MINDMAP and ConceptDraw PROJECT software, allowing to automatically create the spreadsheets reflecting the tasks and project statuses for people who have different project roles. The reporting capabilities of this solution are represented by the possibility to generate a wide range of project reports that allow the project managers, senior management and other project participants to be informed on a project daily progress and monthly objectives: All Inclusive Report, All Visible Columns, Milestones with Notes and Objectives, Projects Goals, Projects Managers, Project Team, and Top Level Tasks. The PM Planning solution from ConceptDraw Solution Park is a strong project management and productivity tool which simplifies the process of reporting and lets one create a document with the desired report, includes the predesigned examples, extends and improves the planning capabilities for all team members, improves the project communication, helps to accurately plan, maintain, and finish projects on time, to track the work of project resources, to perform the analytical work and to make effective decisions.
HelpDesk
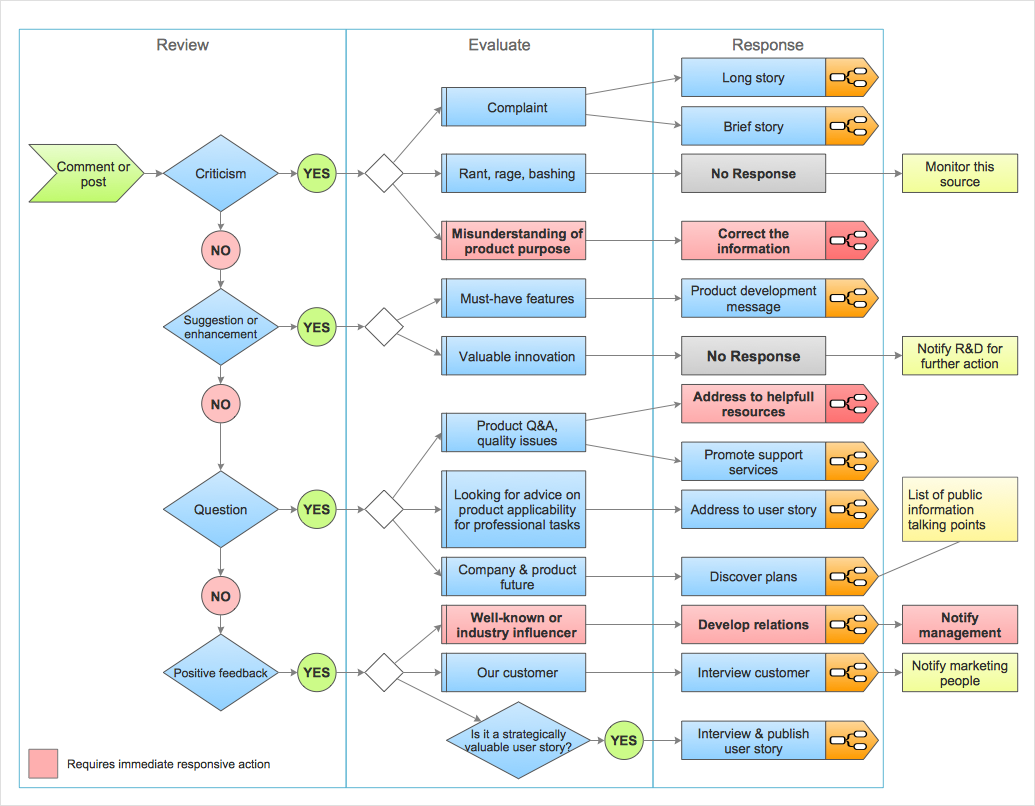
How to Organize a Social Media Activity
 Computer and Networks Area
The solutions from Computer and Networks Area of ConceptDraw Solution Park collect samples, templates and vector stencils libraries for drawing computer and network diagrams, schemes and technical drawings.
HelpDesk
How to Create Education Infographics

 Target and Circular Diagrams
This solution extends ConceptDraw DIAGRAM software with samples, templates and library of design elements for drawing the Target and Circular Diagrams.
- Examples of Flowcharts, Org Charts and More | What is Interactive ...
- Interactive Org Charts
- Interactive Organizational Chart
- Interactive Org Chart Software
- Interactive Org Chart
- Examples of Flowcharts, Org Charts and More | How to Connect Text ...
- Examples of Flowcharts, Org Charts and More | 25 Typical Orgcharts ...
- Examples of Flowcharts, Org Charts and More | Program Evaluation ...
- ConceptDraw Solution Park | Organizational Charts | Interactive ...
- Pyramid Diagram | Examples of Flowcharts, Org Charts and More ...
- Organisational Flow Charts Of Library
- Bar Organizational Chart
- Computer Network Diagrams | Examples of Flowcharts, Org Charts ...
- Example of Organizational Chart | Organizational Charts | Horizontal ...
- Examples of Flowcharts, Org Charts and More | Organizational ...
- Organizational Structure | ConceptDraw PRO - Organizational chart ...
- ConceptDraw PRO - Organizational chart software | Process ...
- Cross-Functional Flowcharts | Business diagrams & Org Charts with ...
- ConceptDraw PRO - Organizational chart software | Create ...
- What is Interactive Flowcharts | Create Response Charts | How to ...