"Order processing is a key element of Order fulfillment. Order processing operations or facilities are commonly called "distribution centers". "Order processing" is the term generally used to describe the process or the work flow associated with the picking, packing and delivery of the packed item(s) to a shipping carrier. The specific "order fulfillment process" or the operational procedures of distribution centers are determined by many factors. Each distribution center has its own unique requirements or priorities." [Order processing. Wikipedia]
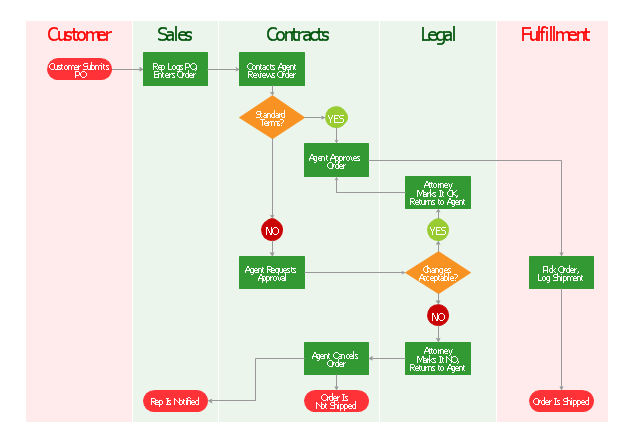
The vertical cross-functional flow chart example "Order processing" was created using the ConceptDraw PRO diagramming and vector drawing software extended with the Flowcharts solution from the area "What is a Diagram" of ConceptDraw Solution Park.
The vertical cross-functional flow chart example "Order processing" was created using the ConceptDraw PRO diagramming and vector drawing software extended with the Flowcharts solution from the area "What is a Diagram" of ConceptDraw Solution Park.
Cross-functional flowchart
Work Order Process Flowchart. Business Process Mapping Examples

EPC Diagrams Illustrate Business Process Work Flows

EPC for Business Process Improvement

ConceptDraw Arrows10 Technology

Check Order Process Flowchart. Flowchart Examples

Social Media Response Management DFD Charts - software tools


How to Create a Cross Functional Flow Chart

BPMN 2.0

 Event-driven Process Chain Diagrams
Event-driven Process Chain (EPC) Diagram is a type of flowchart widely used for modeling in business engineering and reengineering, business process improvement, and analysis. EPC method was developed within the Architecture of Integrated Information Systems (ARIS) framework.
- Process flowchart - Order processing
- Order Management System Uml Case Diagram Examples
- SYSML | Order Management System State Diagram
- SYSML | State Diagram Of Order Management System
- ATM UML Diagrams | Class Diagram For Order Management
- Order processing - Cross-functional flowchart | Order processing ...
- Flowchart Sales Order Processing
- Process Flowchart | Total Quality Management Definition | Cross ...
- ATM UML Diagrams | Order processing center - UML sequence ...
- Entity-Relationship Diagram (ERD) | Order Processing System Er ...