HelpDesk
How to Create a Time Series Dashboard
Time Series Dashboard means integration of some type of diagrams: Line Charts, Bar Charts, Column Charts, and Dot Plots on a single space. The ConceptDraw Time Series Dashboard solution can be used to create the interactive Time Series dashboard. The libraries of Time Series Charts solution contain the Live Objects, that can change their appearance depending on the external data. Each chart from the Time Series dashboard displays particular source data. You can include Time Series Charts in your business or technical dashboards to show and compare the items changing over time.Internet solutions with ConceptDraw DIAGRAM
ConceptDraw is a good means of visualization of information of any kind as it features powerful graphic capabilities. The conception of using ConceptDraw and open formats by the programs that work with Internet can be used for displaying any data and any structure in Internet.HelpDesk
How to Edit a Project Task List
A list of a project tasks is core to any project plan. It is the basic part of a project schedule. The project task list should include all of the work associated with fulfilling the project on time. Having an entire and complete task list, the project manager will be able to estimate the costs and resources, necessary to implement the project. The project task list creation is a key piece of project management. The list of project tasks have include activities, should be performed, and the sequence in which tasks need to be completed.ConceptDraw Solution Park
ConceptDraw Solution Park collects graphic extensions, examples and learning materials
HelpDesk
How to Add conceptdraw.com Domain to Custom Safe Senders List
Instruction on how to add the csodessa to your safe senders' list in order to help ensure that you receive the CS Odessa email that confirms your successful registration.HelpDesk
How to Create an IDEF3 Diagram
IDEF3 is a member of the IDEF family of modeling methods that can be used to describe operations in a business process.An IDEF3 diagram provides a description of an actual process flow within an organization or business or the changes that occur to an object within that system. This method of knowledge capture is recorded in two different perspectives - users are able to create both process schematics and object schematics using the IDEF3 schematic symbols. ConceptDraw has created a solution that collects all symbols necessary to create professional IDEF3 diagrams. IDEF methodology is suitable for almost any form of business, and for anyone who needs to record enterprise architecture in a process driven manner. The IDEF Business Process Diagram solution and ConceptDraw DIAGRAM cater to these needs, giving both beginners and experienced users the tools they need to create effective business process diagrams.
Bubble diagrams in Landscape Design with ConceptDraw DIAGRAM
To define the links between the different areas of your own landscape design and see the project from aside, we recommend to draw landscape diagram called bubble one which is analogue of «mind maps» as it allows us to create approximate image of our future proper landscape view. Use special libraries (and we have plenty of them) with objects of landscape design to be able to create the detailed plan of your landscape which will be looking so smart and professionally good as the samples we provide were created by designers who know so much about making such kinds of design plans. Having ConceptDraw DIAGRAM as the assistant in your work, will ensure the success after using our product. Make the bubble diagrams as well as any other ones in minutes with ease having our application called ConceptDraw DIAGRAM and you will see how quick it will change your life simplifying lots of work.
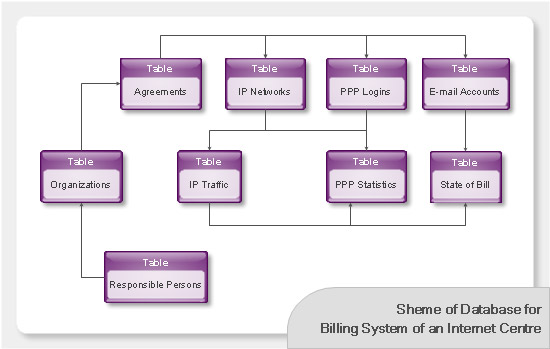
Databases Access Objects Model with ConceptDraw DIAGRAM
ConceptDraw Basic gives the opportunity of interaction with any ODBC-compatible databases. For this the Database Access Objects Model is provided. All calls to the database are made by certain methods of objects of this model.- Data Link Cable Layout
- Data Network Model Free Templates
- Metropolitan area networks (MAN). Computer and Network Examples
- Design elements - Switches
- Metropolitan area networks (MAN). Computer and Network ...
- Cisco products additional - Vector stencils library | Cubicles and ...
- Bus Network Topology | Cisco media - Vector stencils library | Star ...
- Cisco Switches and Hubs. Cisco icons, shapes, stencils and symbols
- Local area network (LAN). Computer and Network Examples ...
- Telecommunication networks. Computer and Network Examples ...
- Physical LAN and WAN diagram
- How to Create the New Library in ConceptDraw PRO | How to Add a ...
- Network Topology | Cisco Network Topology | Hotel Network ...
- How To Create Restaurant Floor Plan in Minutes | Network layout ...
- Campus Area Networks (CAN). Computer and Network Examples ...
- | Security and Access Plans | Network Security Model | Access ...
- Roaming wireless local area network diagram | Call center network ...
- Cisco LAN - Vector stencils library | How to Make a Web Page from ...
- Local area network (LAN). Computer and Network Examples ...
- Office plan - Cubicle layout | Cubicles and work surfaces - Vector ...
- ERD | Entity Relationship Diagrams, ERD Software for Mac and Win
- Flowchart | Basic Flowchart Symbols and Meaning
- Flowchart | Flowchart Design - Symbols, Shapes, Stencils and Icons
- Flowchart | Flow Chart Symbols
- Electrical | Electrical Drawing - Wiring and Circuits Schematics
- Flowchart | Common Flowchart Symbols