ConceptDraw PRO ER Diagram Tool
Entity-relationship model, also called ER-model, is the main tool of domain modeling on the stage of conceptual design. The modeling of domain data structures is based on the use of graphical tools - Entity-Relationship diagrams (ER-diagrams). The core concepts of ER-Diagram are entity, attribute and relationship. ER-diagram lets visually represent the entities, helps effectively document all properties of designed system and to detail the data storages. To represent the elements at ER-model are commonly used Chen’s notation and Crow’s foot notation, each has its pros and cons. The entity on ER-diagram is represented in the form of rectangle, which specifies its name. An attribute is a property of the entity and relationship is an interaction between the entities. The relationship between two entities is called binary, between more than two entities - ternary. Specific software, such as ConceptDraw PRO with Entity-Relationship Diagram (ERD) solution from ConceptDraw Solution Park is helpful for easy creation Entity-Relationship Diagrams.Identifying Quality Management System
The Total Quality Management Diagram solution helps your organization visualize business and industrial processes. Create Total Quality Management diagrams for business process with ConceptDraw software.Stakeholder Mapping Tool
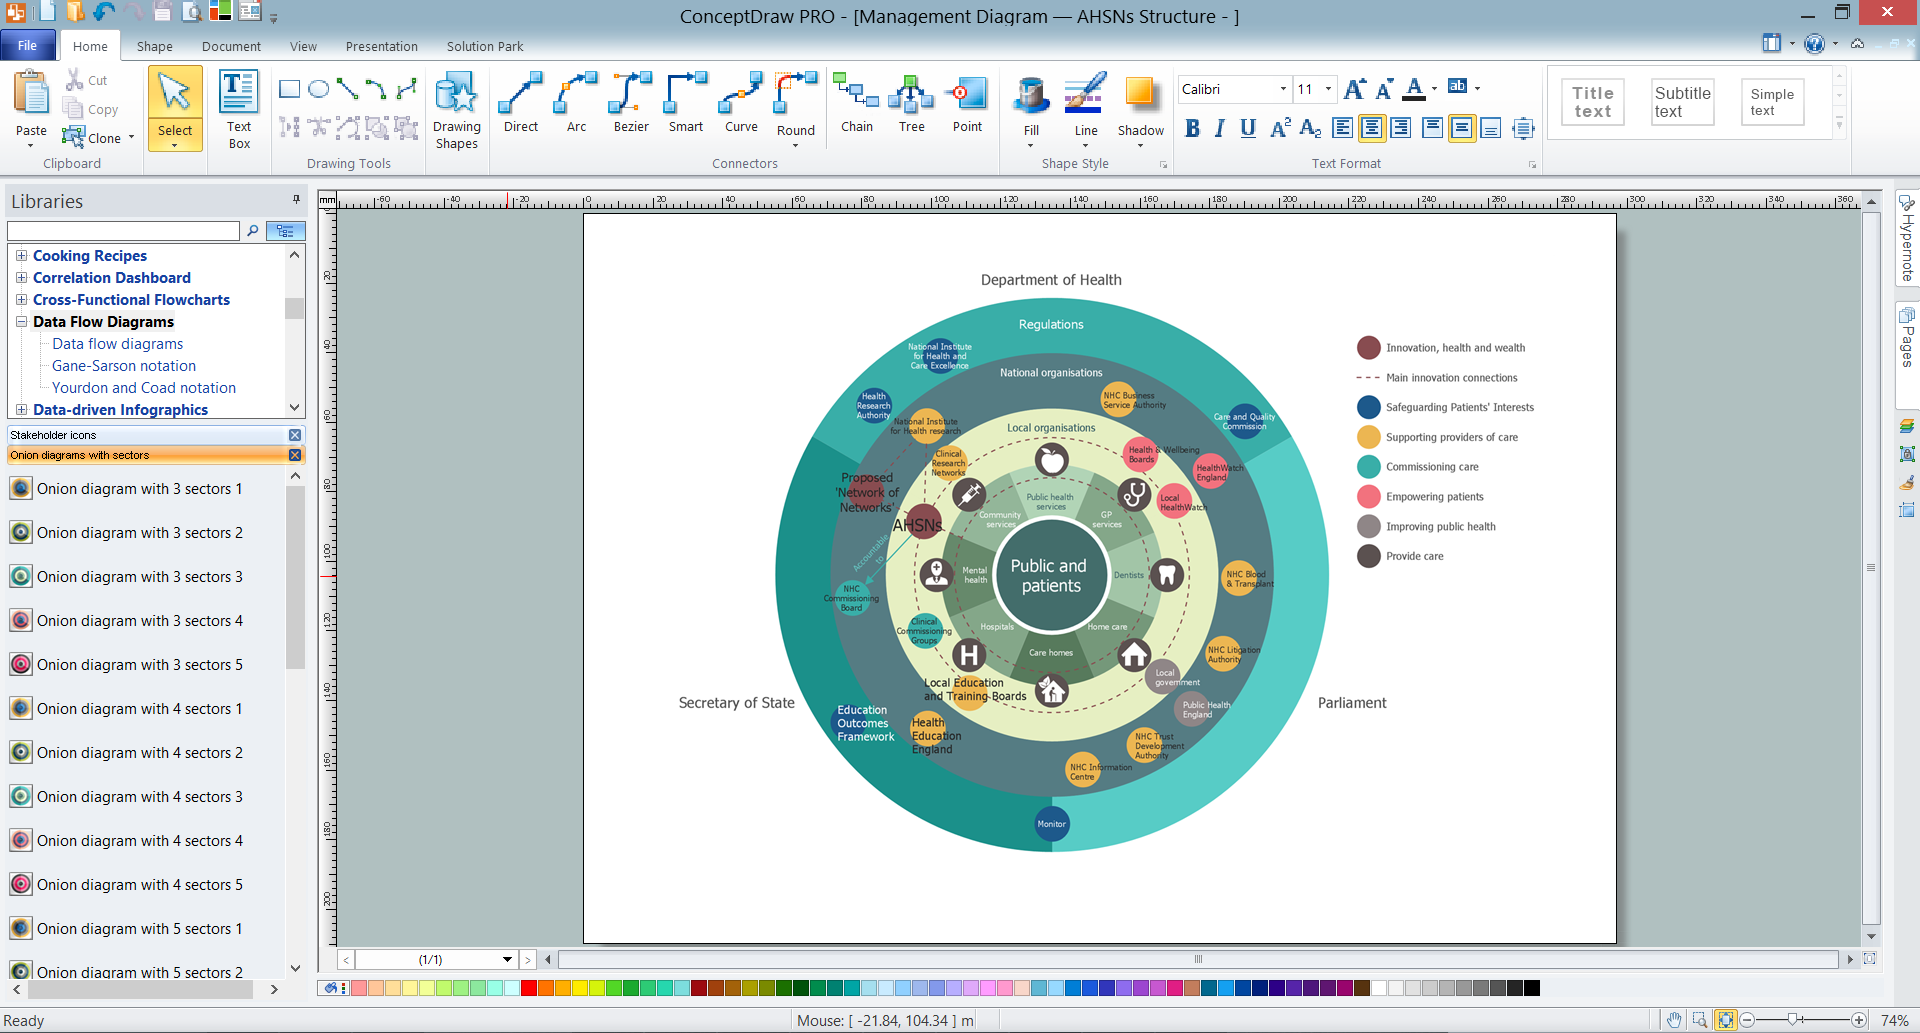
Stakeholders are the groups of people or organizations whose contribution matters to the organization's success, this can be labour participation, financial participation, dissemination of information about organization, etc. So, the employees of the company, its suppliers, customers, media, public organizations, state authorities, all they are stakeholders of the company. ConceptDraw PRO diagramming and vector drawing software extended with Stakeholder Onion Diagrams Solution from the Management Area of ConceptDraw Solution Park is a powerful stakeholder mapping tool which allows easy create Stakeholder Onion diagrams and maps depicting the layers of a project, relationships of stakeholders to a project goal, and relationships between stakeholders.HR Management Software
Human resource management (HRM) is a professional discipline which oversees and manages an organization's human resources, and aspires maximize employee performance for an employer's strategic objectives. The HR Management Software is an incredibly powerful tool for those who need to analyze or present human resource process flows in a visually effective manner.SSADM Diagram
The vector stencils library SSADM from the solution Systems engineering contains specific symbols of SSADM diagrams for ConceptDraw PRO diagramming and vector drawing software. The Systems engineering solution is contained in Software Development area of ConceptDraw Solution Park. The example below illustrates the waterfall model used in SSADM. This model involves 5 stages of developing a product such as requirements specification and its' analysis, design, coding and testing.Types of Flowchart - Overview
When designing a process or an instruction in clear and understandable way, you should consider creating a flowchart. You can avoid spending a lot of time understanding complex concepts as they get clear with different diagrams. The flowcharts are very popular diagram type, they are useful at different fields from the description business processes to the presentation of cooking recipes. Basic Flowchart, Business Process Modeling Diagram, Process Flowchart, Cross Functional Flowchart, Procedure Flowchart, Data Flow Diagram, IDEF Flowchart, SDL Diagram, Workflow Diagram, Document Flowchart, Program Flowchart, Value Stream Map, System Flowchart, Highlight Flowchart, Sales Flowchart are the main types flowchart. The ConceptDraw PRO is one of the professional applications which has great advantages and using which you can create different types of Flowcharts easy and fast. Try to draw an illustrative and comprehensible diagram in ConceptDraw PRO describing the processes instead of writing complex long text and make sure how it is convenient. Visio is expensive, and if you use it in a team environment, these costs are compounded. ConceptDraw PRO is an affordable alternative to Visio and luckily, it comes with a team plan. ConceptDraw PRO can import and export Visio files, so Mac users can collaborate with PC users stuck on Microsoft's software.
Human Resource Development
Human Resource Development (HRD) focuses on the help employees develop their personal and organizational skills, abilities, and knowledge, HRD also helps to adapt an organization to the changing of external environment. ConceptDraw PRO diagramming and vector drawing software supplied with HR Flowcharts Solution from the Management Area of ConceptDraw Solution Park can effectively help in labour-intensive process of human resource development.How to Draw Business Process Diagrams with RapidDraw Interface
Business Process Modeling Notation (BPMN) is a set of standard symbols that allow you to create a graphical view of a business process. The symbols were developed to help users develop standard, unified structure of processes, and any messages shared between these processes.Flowchart Symbols Accounting. Activity-based costing (ABC) flowchart
The Accounting Flowcharts are helpful and popular kind of flowcharts in a field of business, finance and accounting. The ConceptDraw PRO diagramming software enhanced with Accounting Flowcharts solution from the Finance and Accounting area of ConceptDraw Solution Park is extremely comfortable for visually explaining the accounting processes and for designing Accounting Flowcharts and Accounting Process Flow Diagrams of any complexity. The library of vector design elements included to Accounting Flowcharts solution provides you with major accounting flowchart symbols, which make the drawing process incredibly easy and convenient. The use of them for designing of such sort of Accounting Flowcharts as the Activity-based costing (ABC) flowcharts will simplify the drawing process and will allow to make these flowcharts in a few minutes in ConceptDraw PRO. Design easily your own ABC flowcharts to demonstrate in details the relations and logics of activity-based distribution the costs between the company's units and departments.UML Business Process
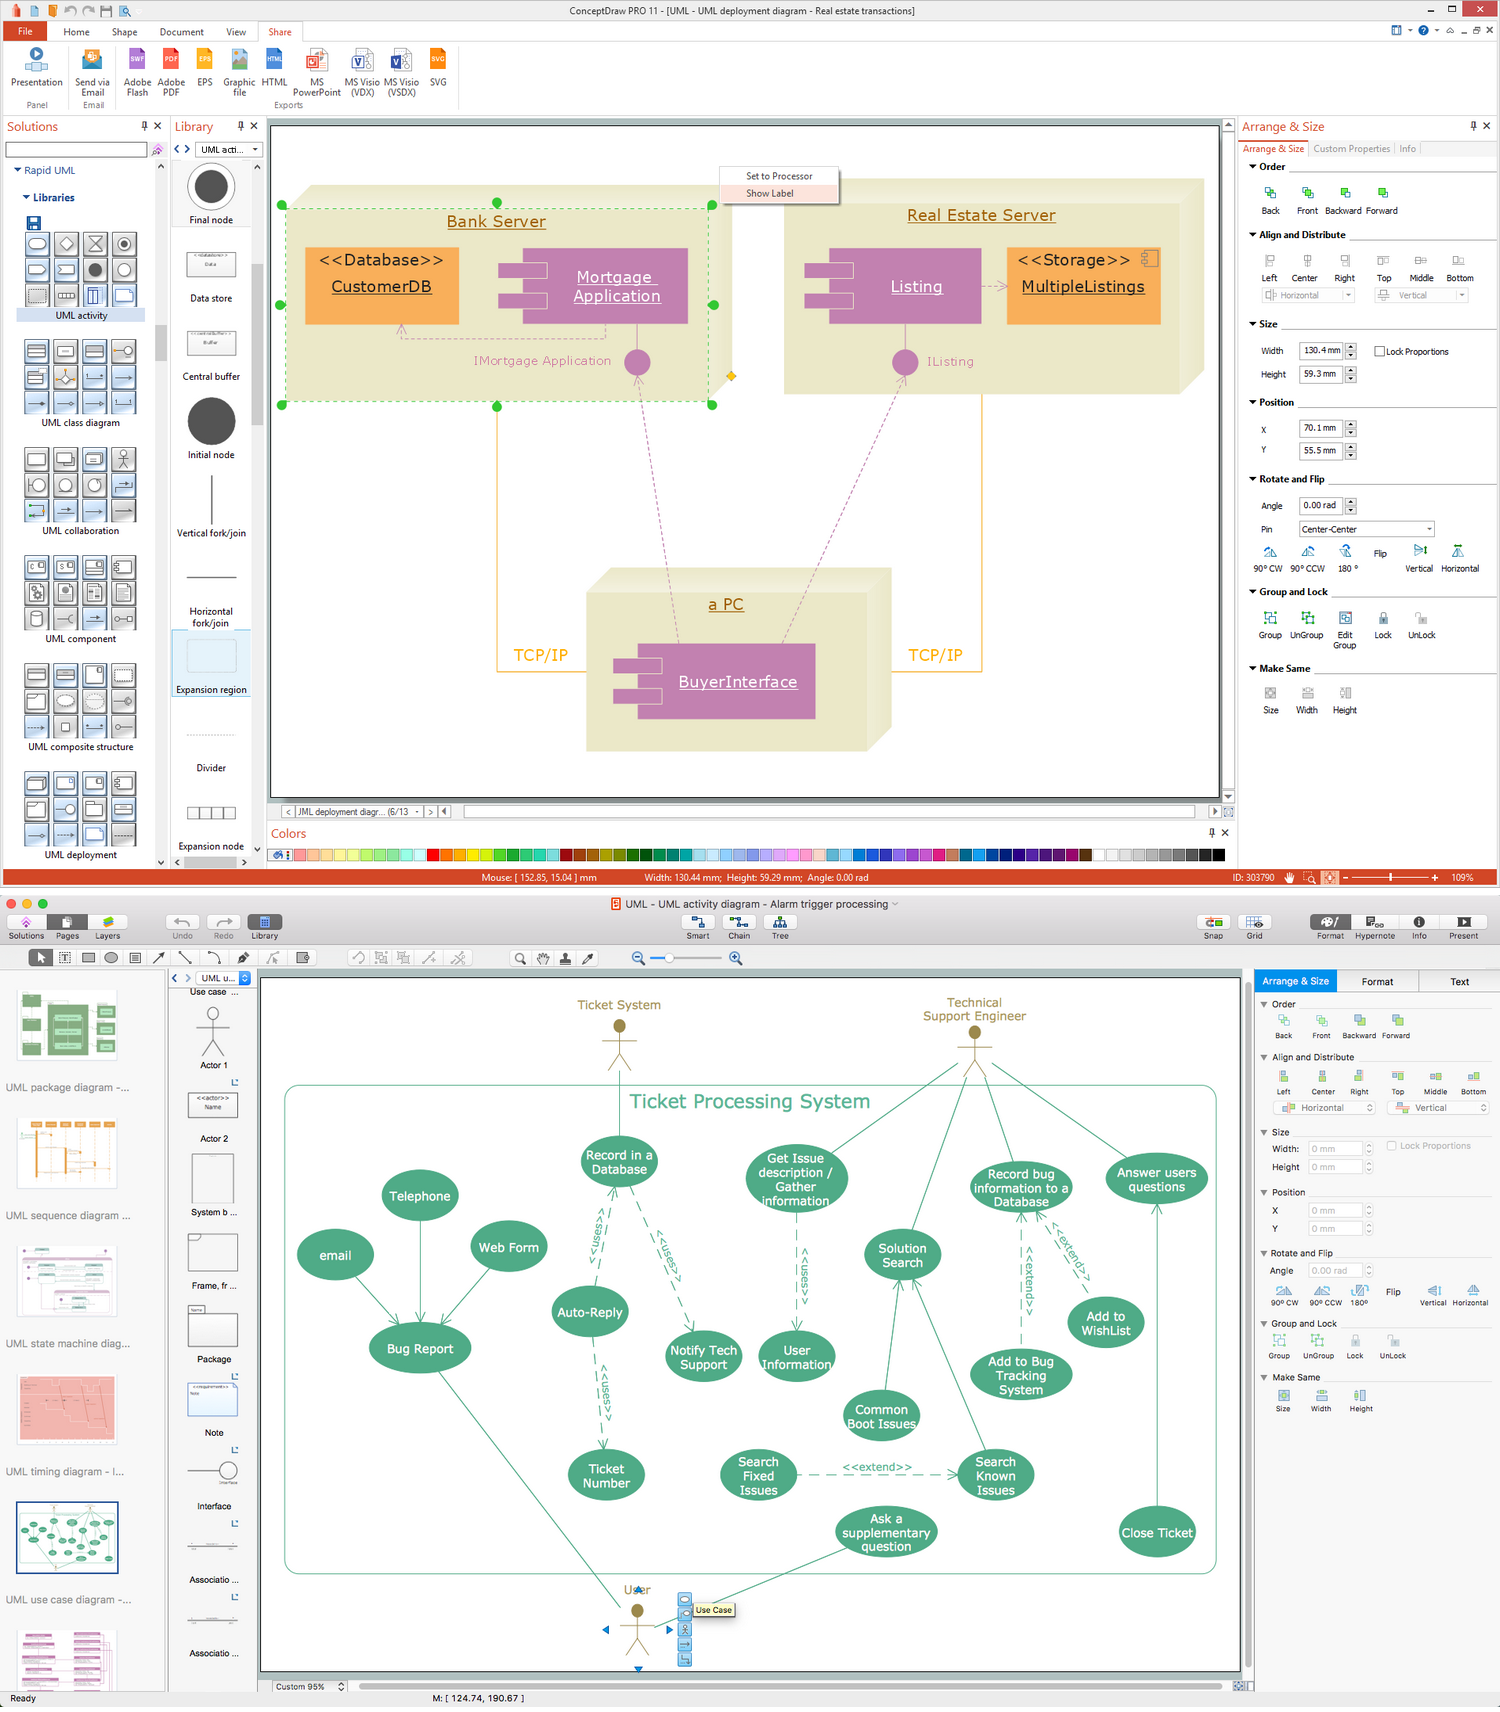
UML diagrams of business processes. The Rapid UML solution provides diagram examples, templates and vector stencils libraries for quick and easy drawing all types of UML 2.x and 1.x diagrams: UML activity diagrams, UML communication (collaboration) diagrams, UML component diagrams, UML composite structure diagrams, UML deployment diagrams, UML interaction overview diagrams, UML object diagrams, UML package diagrams, UML sequence diagrams, UML state machine diagrams, UML timing diagrams, UML use case diagrams.- Labour Management System Project Data Flow Diagram
- Process Flow Chart Management
- Project management life cycle - Flowchart | Logistics Flow Charts ...
- Flow Chart Of Human Resource Management System
- Six Markets Model Chart Template | Basic Flowchart Examples ...
- Data Flow Diagram For Dental Clinic Management System
- Hr Management Flow Chart
- HR management process - Flowchart | HR Flowchart Symbols | How ...
- Project Cost Management Process Flows Ppt
- Sales Process Flow Chart


