This is a schematic process flow diagram of the processes used in a typical oil refinery.
This process flow diagram (PFD) example was redesigned from the Wikimedia Commons file: RefineryFlow.png. [commons.wikimedia.org/ wiki/ File:RefineryFlow.png]
This file is licensed under the Creative Commons Attribution-Share Alike 3.0 Unported license. [creativecommons.org/ licenses/ by-sa/ 3.0/ deed.en]
"An oil refinery or petroleum refinery is an industrial process plant where crude oil is processed and refined into more useful products such as petroleum naphtha, gasoline, diesel fuel, asphalt base, heating oil, kerosene and liquefied petroleum gas. Oil refineries are typically large, sprawling industrial complexes with extensive piping running throughout, carrying streams of fluids between large chemical processing units. In many ways, oil refineries use much of the technology of, and can be thought of, as types of chemical plants. The crude oil feedstock has typically been processed by an oil production plant. There is usually an oil depot (tank farm) at or near an oil refinery for the storage of incoming crude oil feedstock as well as bulk liquid products.
An oil refinery is considered an essential part of the downstream side of the petroleum industry." [Oil refinery. Wikipedia]
The PFD example "Process flow diagram - Typical oil refinery" was created using the ConceptDraw PRO diagramming and vector drawing software extended with the Chemical and Process Engineering solution from the Chemical and Process Engineering area of ConceptDraw Solution Park.
Process Flow Diagram (PFD)
-process-flow-diagram---typical-oil-refinery.png--diagram-flowchart-example.png)
Basic Flowchart Examples

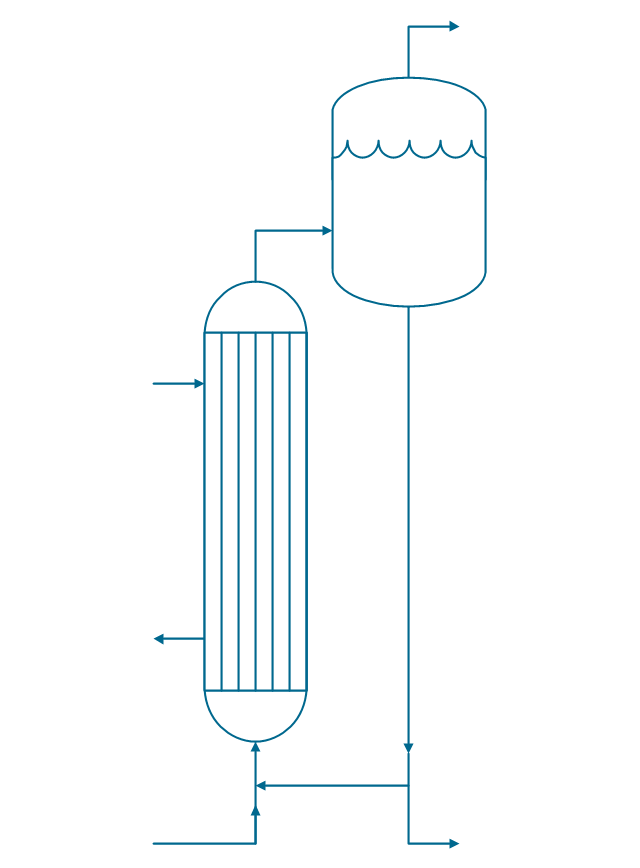
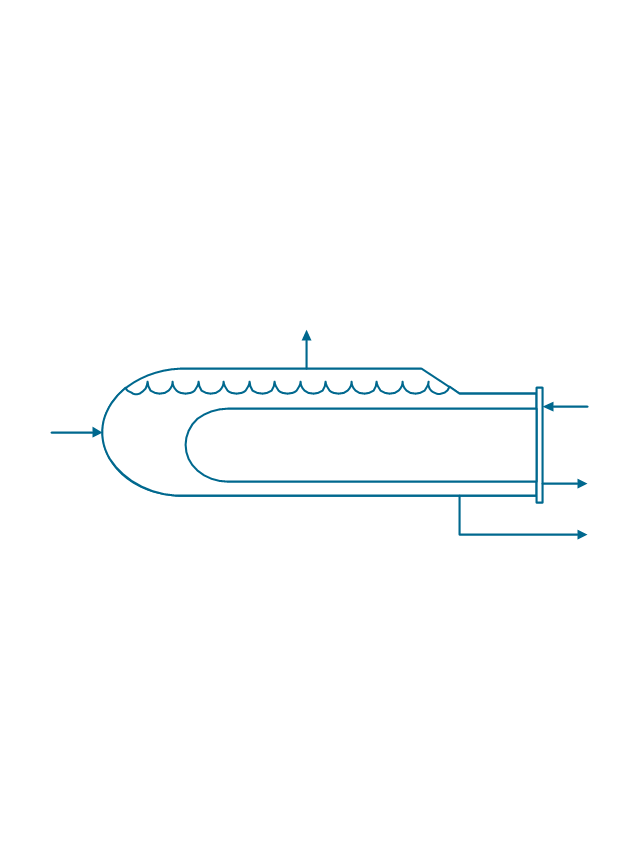
This process flow diagram (PFD) of a typical crude oil distillation unit as used in petroleum crude oil refineries was redrawn from Wikipedia file: Crude Oil Distillation Unit.png. [en.wikipedia.org/ wiki/ File:Crude_ Oil_ Distillation_ Unit.png]
This file is licensed under the Creative Commons Attribution-Share Alike 3.0 Unported license. [creativecommons.org/ licenses/ by-sa/ 3.0/ deed.en]
"An oil refinery or petroleum refinery is an industrial process plant where crude oil is processed and refined into more useful products such as petroleum naphtha, gasoline, diesel fuel, asphalt base, heating oil, kerosene and liquefied petroleum gas. Oil refineries are typically large, sprawling industrial complexes with extensive piping running throughout, carrying streams of fluids between large chemical processing units. In many ways, oil refineries use much of the technology of, and can be thought of, as types of chemical plants. The crude oil feedstock has typically been processed by an oil production plant. There is usually an oil depot (tank farm) at or near an oil refinery for the storage of incoming crude oil feedstock as well as bulk liquid products.
An oil refinery is considered an essential part of the midstream side of the petroleum industry." [en.wikipedia.org/ wiki/ Oil_ refinery]
The process flow diagram (PFD) example "Crude oil distillation" was drawn using the ConceptDraw PRO diagramming and vector drawing software extended with the Chemical and Process Engineering solution from the Chemical and Process Engineering area of ConceptDraw Solution Park.
Process flow diagram (PFD)
-crude-oil-distillation-unit---pfd.png--diagram-flowchart-example.png)
Process Flow Diagram

How to Create Flowcharts for an Accounting Information System

Types of Flowcharts


Business Process Flowchart

Cross-Functional Flowchart Basics

Double-headed Cross Functional Flowchart

Create a Cross-Functional Flowchart

ConceptDraw Arrows10 Technology

Example of Organizational Chart


Program Structure Diagram

 Picture Graphs
Typically, a Picture Graph has very broad usage. They many times used successfully in marketing, management, and manufacturing. The Picture Graphs Solution extends the capabilities of ConceptDraw PRO v10 with templates, samples, and a library of professionally developed vector stencils for designing Picture Graphs.
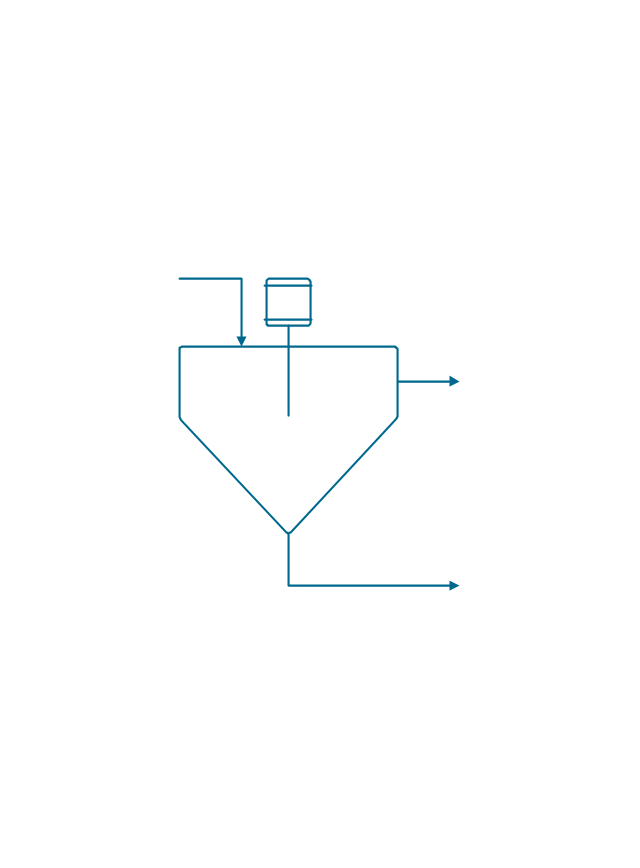
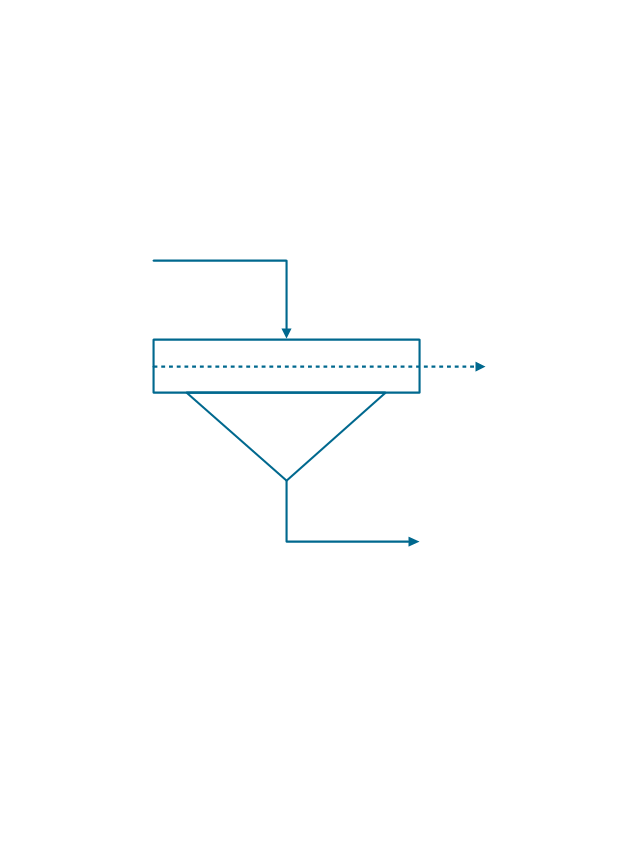
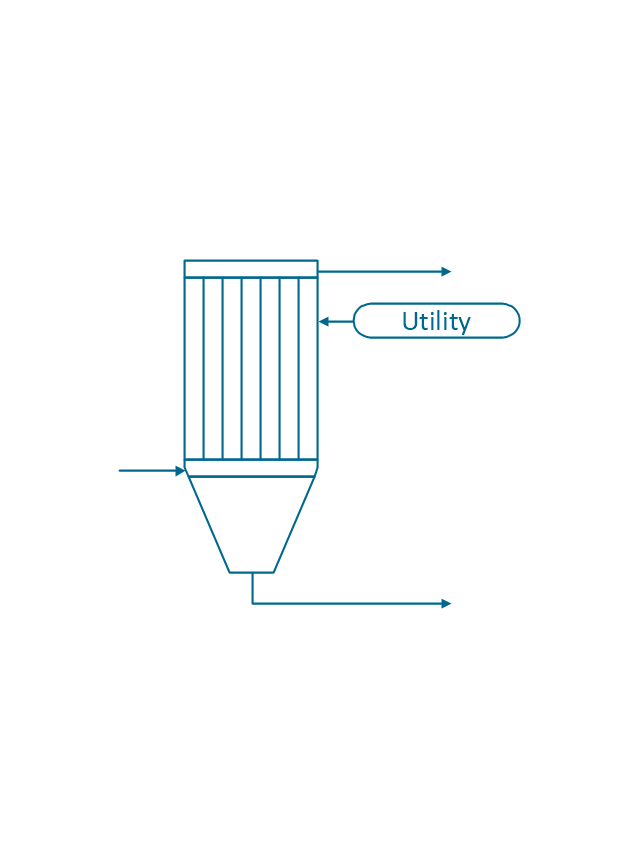
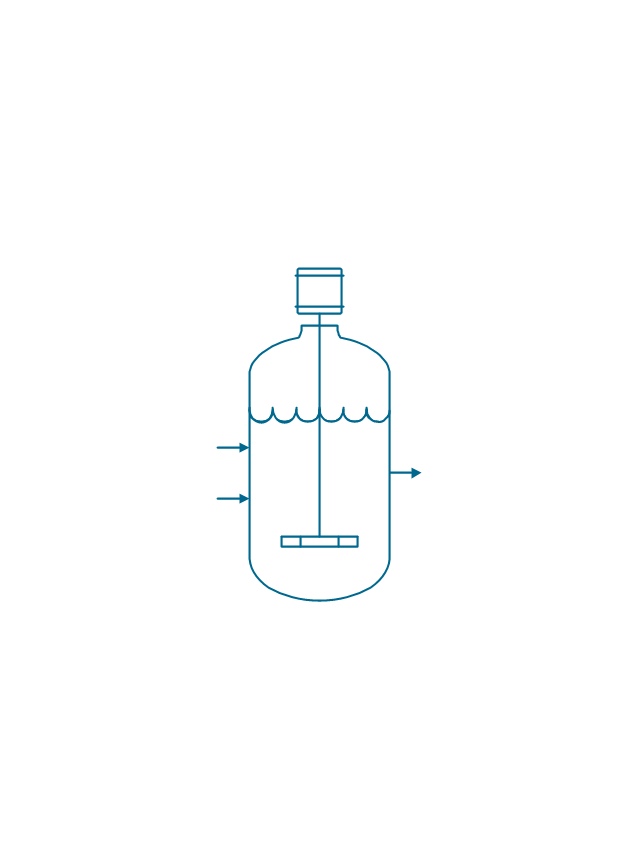
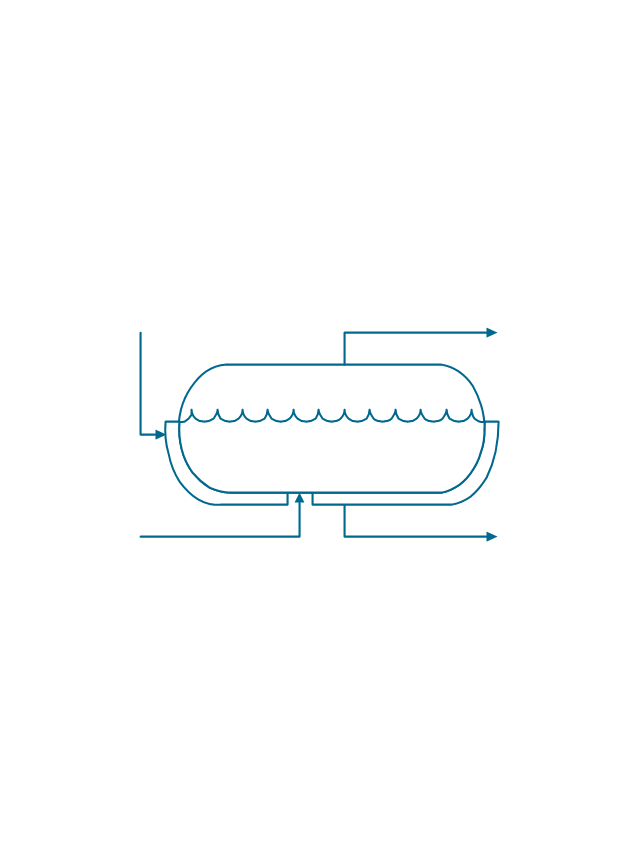
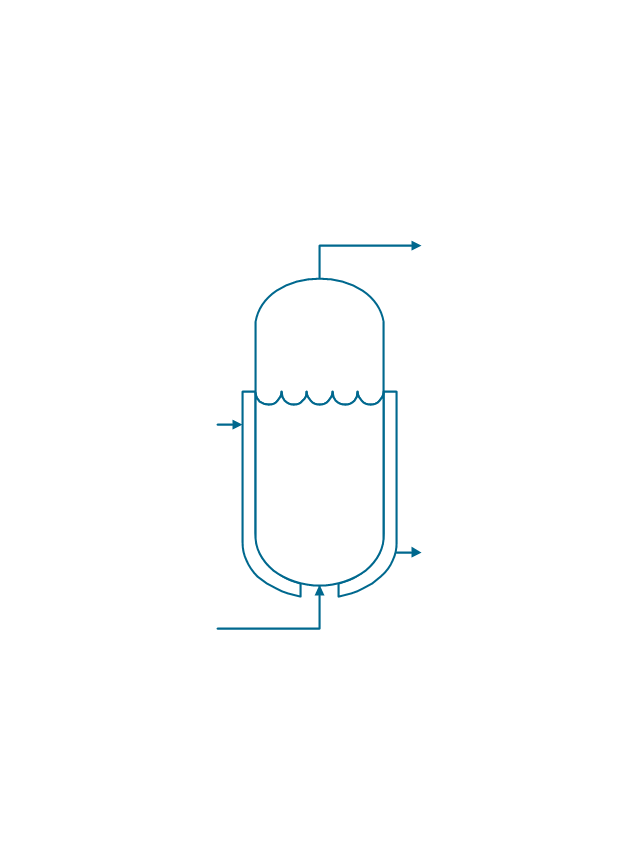
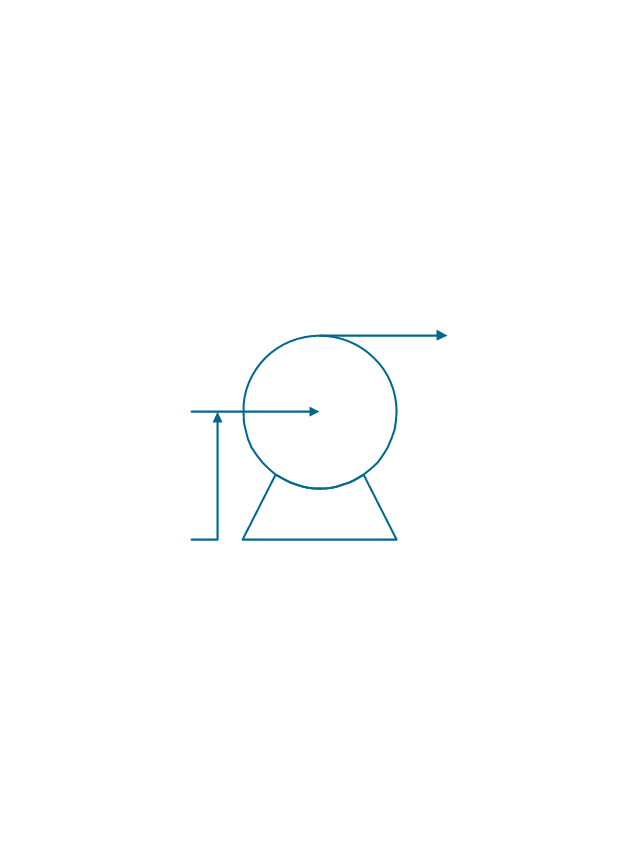
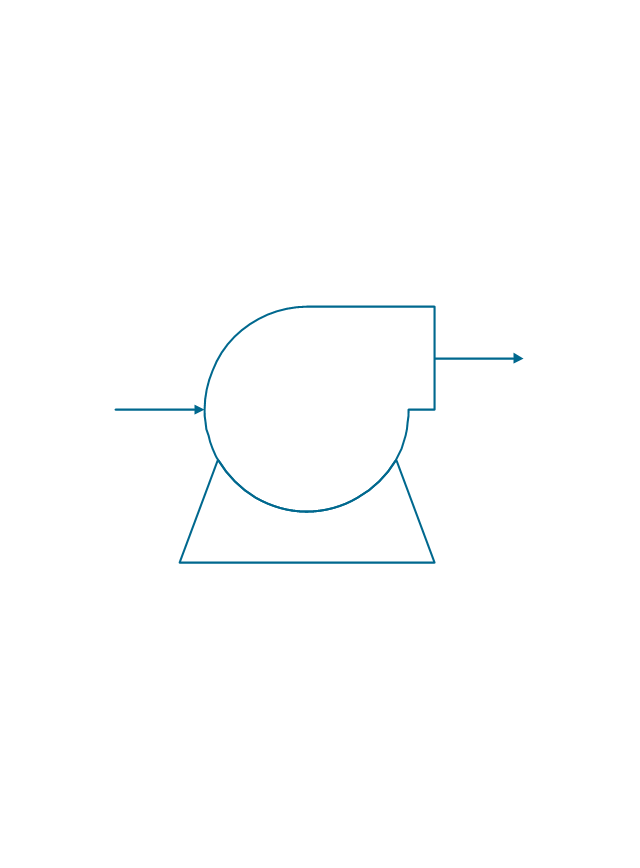
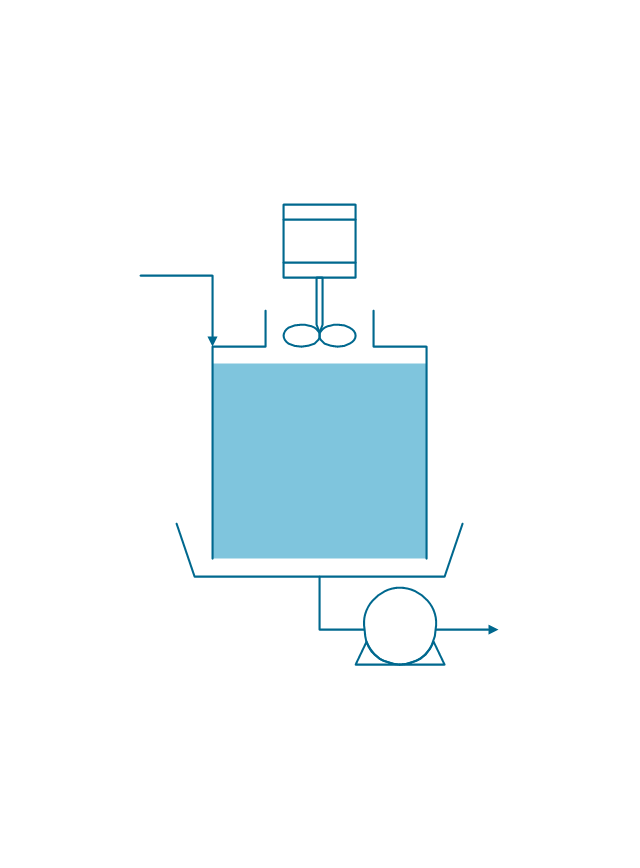
The vector stencils library "Chemical engineering" contains 24 symbols of chemical and process engineering equipment.
Use these shapes for drawing Process Flow Diagrams (PFD), Piping and Instrumentation Diagrams (P&ID), and Water Flow Diagrams in the ConceptDraw PRO software extended with the Chemical and Process Engineering solution from the Chemical and Process Engineering area of ConceptDraw Solution Park.
www.conceptdraw.com/ solution-park/ engineering-chemical-process
Clarifier
Screen
Filter
Agitator
Vapor 1
Vapor 2
Vessel

Pump mixer
Centrifugal pump

Fan
Blower

Evaporator
Tower
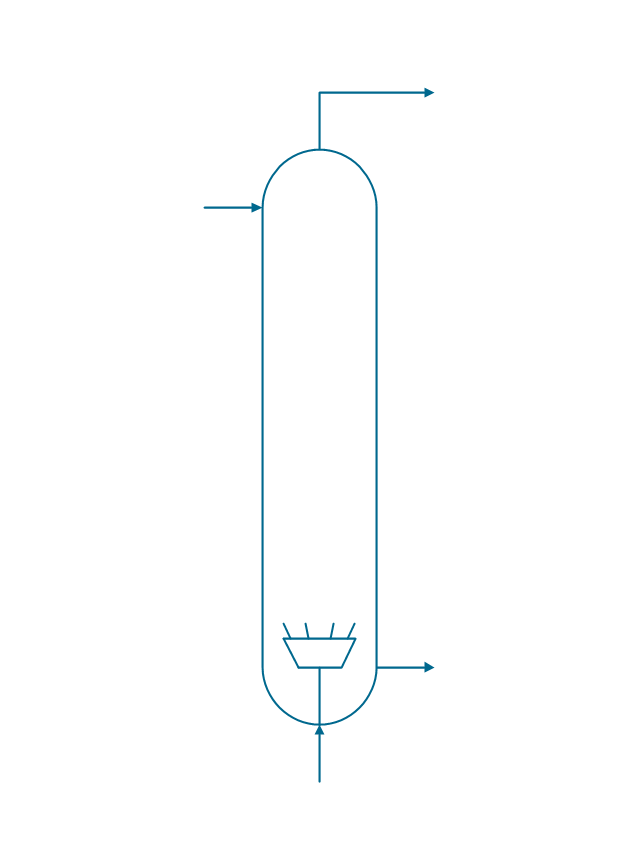
Flash drum
Roll press
Cooling tower
Tank car

Tank truck

Kettle
Valve

Motor valve

Venturi

Propeller

Instrument

- Oil And Gas Production Process Flow Diagram
- Process flow diagram - Typical oil refinery | Crude oil distillation unit ...
- Oil Production Process Flow Diagram
- Process flow diagram - Typical oil refinery | Crude oil distillation unit ...
- Chemical Engineering | Process Flow Diagram | Crude oil distillation ...
- Process flow diagram - Typical oil refinery | Process Flow Diagram ...
- Oil Production Flow Chart
- Crude oil distillation unit - PFD | Process flow diagram - Typical oil ...
- Process flow diagram - Typical oil refinery | Flowchart For Production
- Processes And Flow Chart In Crude Oil Production
- Process Flow Diagram Oil And Gas Production
- Flow Chart Of Oil Production
- Sample Oil And Gas Process Flow Diagram In Pdf
- Crude oil distillation unit - PFD | Jet fuel mercaptan oxidation treating ...
- Oil And Gas Production Process Flow Diagram Pdf
- Crude oil distillation unit - PFD | Manufacture Of Gasoline Flow Chart
- Gas Production Flow Sheet Diagram
- Tyipical Production Process Flow Chart
- Process Flowchart | Crude oil distillation unit - PFD | Detailed ...
- Pump Production Flow Chart