Bubble diagrams in Landscape Design with ConceptDraw DIAGRAM

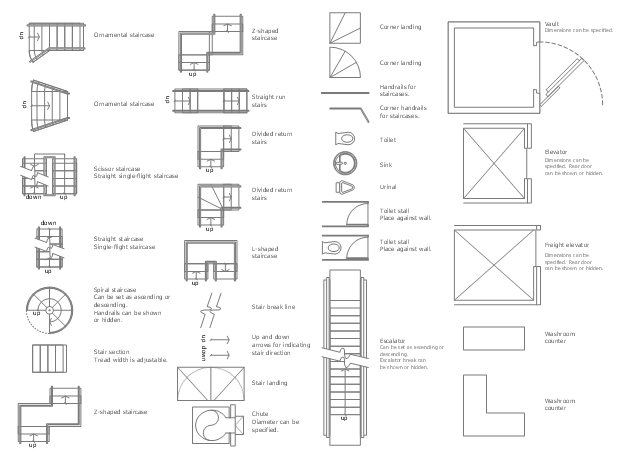
The design elements library Building core contains 80 symbols of stairs, elevators, escalators, restroom fixtures, and a safe.
Use the shapes library Building core to draw the structural diagrams, bathroom layouts, building automation, architectural drawings, and riser diagrams, as well as space plans, store and shopping mall plans, and facility planning, plant layouts using the ConceptDraw PRO diagramming and vector drawing software.
"In architecture and building engineering, a floor plan otherwise known as a Scottish plan is a drawing to scale, showing a view from above, of the relationships between rooms, spaces and other physical features at one level of a structure.
The term may be used in general to describe any drawing showing the physical layout of objects.
A floor plan could show:
Interior walls and hallways;
Restrooms;
Windows and doors;
Appliances such as stoves, refrigerators, water heater etc.;
Interior features such as fireplaces, saunas and whirlpools;
The use of all rooms shall be indicated." [Floor plan. Wikipedia]
The vector stencils library Building core is provided by the Floor Plans solution from the Building Plans area of ConceptDraw Solution Park.
HelpDesk
How to Create a New Library

HelpDesk
How to Create a Time Series Dashboard

HelpDesk
How to Draw a Block Diagram

HelpDesk
How to Create a Mechanical Diagram
HelpDesk
How to Create a Cross-Functional Flowchart

- How To use Furniture Symbols for Drawing Building Plan | How To ...
- How To Create Restaurant Floor Plan in Minutes | Building Drawing ...
- Building Drawing Software for Design Office Layout Plan | How To ...
- How To Create Restaurant Floor Plan in Minutes | Interior Design ...
- Basketball | How to Resize Objects in ConceptDraw PRO | How to ...
- How To Create Restaurant Floor Plan in Minutes
- Cafe and Restaurant Floor Plan | How To use Furniture Symbols for ...
- Landscape Plan View Drawing
- How To Create Restaurant Floor Plan in Minutes | Building Drawing ...
- How To Create Restaurant Floor Plan in Minutes | How To use ...
- How To Draw Building Plans | How To Create Restaurant Floor Plan ...
- How To Create Restaurant Floor Plan in Minutes | Interior Design ...
- Building Drawing Software for Design Office Layout Plan | Design ...
- How To Draw Building Floor Plans And Dimensions
- How To use House Electrical Plan Software | Cafe electrical floor ...
- How To Create Restaurant Floor Plan in Minutes | Building Drawing ...
- How to Draw a Floor Plan for Your Office | Building Drawing ...
- How to Create a Floor Plan Using ConceptDraw PRO | Network ...
- How To Draw Building Plans | Design elements - Building core ...
- How To Draw Stairs On Floor Plan