Physics Symbols

Physics Diagrams

HelpDesk
How to Draw Physics Diagrams in ConceptDraw PRO
")
 Physics
Physics solution extends ConceptDraw PRO software with templates, samples and libraries of vector stencils for drawing the physical illustrations, diagrams and charts.
Fault Tree Analysis Software

The vector stencils library "Fault tree analysis diagrams" contains 12 symbols for drawing Fault Tree Analysis (FTA) diagrams.
"Fault tree analysis (FTA) is a top down, deductive failure analysis in which an undesired state of a system is analyzed using Boolean logic to combine a series of lower-level events. This analysis method is mainly used in the fields of safety engineering and reliability engineering to understand how systems can fail, to identify the best ways to reduce risk or to determine (or get a feeling for) event rates of a safety accident or a particular system level (functional) failure. FTA is used in the aerospace, nuclear power, chemical and process, pharmaceutical, petrochemical and other high-hazard industries; but is also used in fields as diverse as risk factor identification relating to social service system failure.
In aerospace, the more general term "system Failure Condition" is used for the "undesired state" / Top event of the fault tree. These conditions are classified by the severity of their effects. The most severe conditions require the most extensive fault tree analysis. These "system Failure Conditions" and their classification are often previously determined in the functional Hazard analysis." [Fault tree analysis. Wikipedia]
The shapes example "Fault tree analysis diagrams" was created using the ConceptDraw PRO diagramming and vector drawing software extended with the Fault Tree Analysis Diagrams solution from the Engineering area of ConceptDraw Solution Park.
FTA diagram symbols

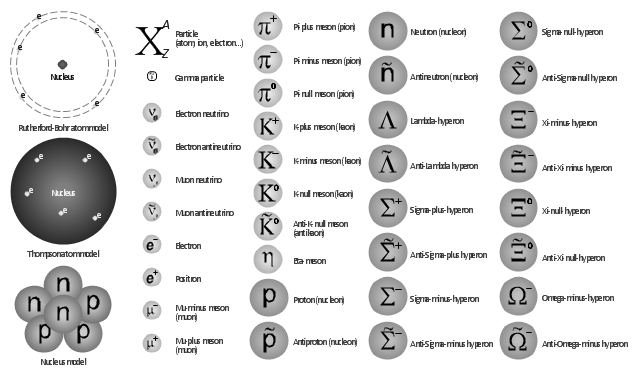
The vector shapes library "Nuclear physics" contains 39 symbol icons of elementary particles for drawing diagrams of nuclear reactions and experiments in nuclear physics.
"Nuclear physics is the field of physics that studies the constituents and interactions of atomic nuclei. The most commonly known applications of nuclear physics are nuclear power generation and nuclear weapons technology, but the research has provided application in many fields, including those in nuclear medicine and magnetic resonance imaging, ion implantation in materials engineering, and radiocarbon dating in geology and archaeology.
The field of particle physics evolved out of nuclear physics and is typically taught in close association with nuclear physics." [Nuclear physics. Wikipedia]
The example "Design elements - Nuclear physics" was created using the ConceptDraw PRO diagramming and vector drawing software extended with the Physics solution from the Science and Education area of ConceptDraw Solution Park.
Elementary particles
Types of Flowcharts


This example was redesigned from the Wikimedia Commons file: Example of High Level Fault Tree.jpg. [commons.wikimedia.org/ wiki/ File:Example_ of_ High_ Level_ Fault_ Tree.jpg]
"Risk assessment is the determination of quantitative or qualitative value of risk related to a concrete situation and a recognized threat (also called hazard). Quantitative risk assessment requires calculations of two components of risk (R):, the magnitude of the potential loss (L), and the probability (p) that the loss will occur. Acceptable risk is a risk that is understood and tolerated usually because the cost or difficulty of implementing an effective countermeasure for the associated vulnerability exceeds the expectation of loss.
In all types of engineering of complex systems sophisticated risk assessments are often made within Safety engineering and Reliability engineering when it concerns threats to life, environment or machine functioning. The nuclear, aerospace, oil, rail and military industries have a long history of dealing with risk assessment. Also, medical, hospital, social service and food industries control risks and perform risk assessments on a continual basis. Methods for assessment of risk may differ between industries and whether it pertains to general financial decisions or environmental, ecological, or public health risk assessment." [Risk assessment. Wikipedia]
The FTA diagram example "High level fault tree" was created using the ConceptDraw PRO diagramming and vector drawing software extended with the Fault Tree Analysis Diagrams solution from the Engineering area of ConceptDraw Solution Park.
FTA diagram

Basic Flowchart Symbols and Meaning


 Education
This solution extends ConceptDraw PRO and ConceptDraw MINDMAP with specific content that helps illustrate educational documents, presentations, and websites quickly and easily with astronomy, chemistry, math and physics vector pictures and clip art.
Value Stream Mapping Symbols

- How to Draw Physics Diagrams in ConceptDraw PRO | Physics ...
- Physics Diagrams | Physics Symbols | Astronomy Symbols | Drawing ...
- Design elements - Nuclear physics | Nuclear physics - Vector ...
- Physics Diagrams | Physics | Physics Symbols | Physics Diagram
- Electrician Diagrams
- Root cause analysis tree diagram - Personal problem solution ...
- Physics Diagrams | Physics Symbols | Physics | Best Software For ...
- Safety Engineering Analysis
- Physics Diagrams | How to Draw Physics Diagrams in ConceptDraw ...
- Design elements - UML use case diagrams
- Physics Symbols | Physics | Physics Diagrams | Symbol Of All Using ...
- Mechanical Engineering | How to Create a Mechanical Diagram ...
- Design elements - Nuclear physics | Standard Model theory ...
- IVR mobile operator diagram | Operator hierarchy - Natural ...
- Entity Relationship Diagram Software Engineering | Process ...
- Engineering Fault Tree Analysis Diagrams
- FTA diagram - Hazard analysis | Design elements - Fault tree ...
- Cisco Optical. Cisco icons, shapes, stencils and symbols | Physics ...
- Technical Drawing Software | Process Flowchart | How to Draw ...
- Physics Diagrams | Physics Symbols | How to Draw Physics ...