The vector stencils library "Chemical engineering" contains 24 symbols of chemical and process engineering equipment.
Use these shapes for drawing block flow diagrams (BFD), process flow diagrams (PFD), piping and instrumentation diagrams (P&ID), and water flow diagrams.
"Chemical engineering is a branch of engineering that applies the natural (or experimental) sciences (e.g., chemistry and physics) and life sciences (e.g. biology, microbiology and biochemistry) together with mathematics and economics to production, transformation, transportation and proper usage of chemicals, materials and energy. It essentially deals with the engineering of chemicals, energy and the processes that create and/ or convert them. Modern chemical engineers are concerned with processes that convert raw-materials or (cheap)chemicals into more useful or valuable forms. In addition, they are also concerned with pioneering valuable materials and related techniques – which are often essential to related fields such as nanotechnology, fuel cells and bioengineering. Within chemical engineering, two broad subgroups include design, manufacture, and operation of plants and machinery in industrial chemical and related processes ("chemical process engineers") and development of new or adapted substances for products ranging from foods and beverages to cosmetics to cleaners to pharmaceutical ingredients, among many other products ("chemical product engineers")." [Chemical engineering. Wikipedia]
The example "Design elements - Chemical engineering" was created using the ConceptDraw PRO diagramming and vector drawing software extended with the Chemical and Process Engineering solution from the Engineering area of ConceptDraw Solution Park.
Chemical engineering symbols

Cause and Effect Analysis - Fishbone Diagrams for Problem Solving

Cause and Effect Diagrams

Cause and Effect Diagram

The vector stencils library "Chemical engineering" contains 24 symbols of chemical and process engineering equipment.
Use these shapes for drawing Process Flow Diagrams (PFD), Piping and Instrumentation Diagrams (P&ID), and Water Flow Diagrams in the ConceptDraw PRO software extended with the Chemical and Process Engineering solution from the Chemical and Process Engineering area of ConceptDraw Solution Park.
www.conceptdraw.com/ solution-park/ engineering-chemical-process
Clarifier
Screen
Filter
Agitator
Vapor 1
Vapor 2
Vessel

Pump mixer
Centrifugal pump
Fan
Blower
Evaporator
Tower
Flash drum
Roll press
Cooling tower
Tank car

Tank truck

Kettle
Valve

Motor valve

Venturi

Propeller

Instrument
Total Quality Management Business Diagram

Cause and Effect Diagram Software

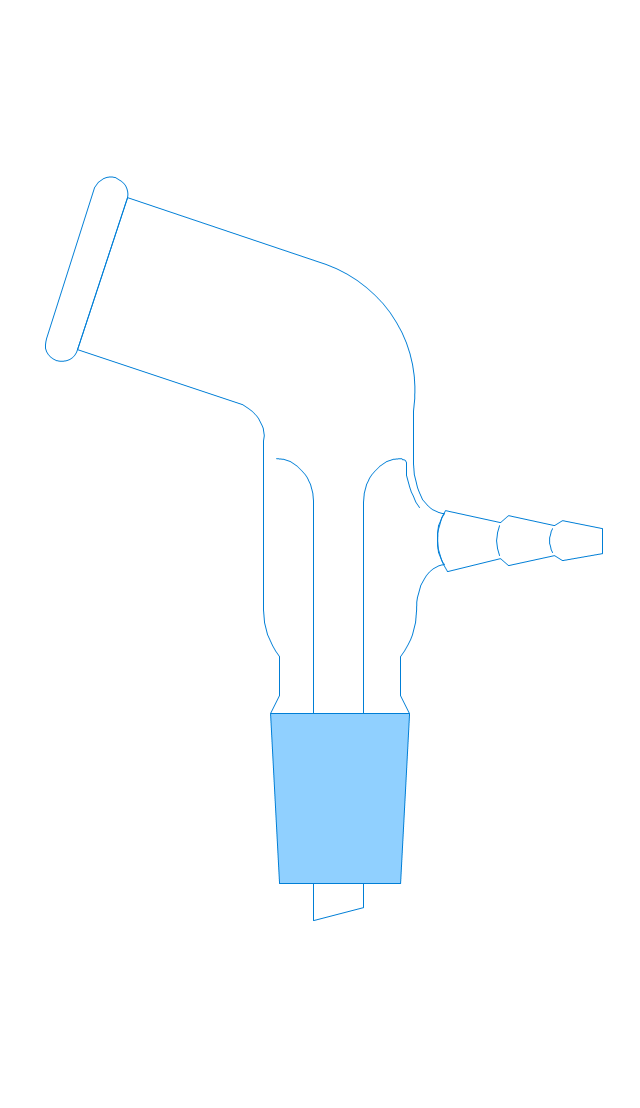
The vector stencils library "Laboratory equipment" contains 31 clipart icons of chemical laboratory equipment and labware.
Use these shapes for drawing part assembly and mounting schemes of glassware apparatus in chemical experiment diagrams and illustrations in the ConceptDraw PRO diagramming and vector drawing software extended with the Chemistry solution from the Science and Education area of ConceptDraw Solution Park.
Use these shapes for drawing part assembly and mounting schemes of glassware apparatus in chemical experiment diagrams and illustrations in the ConceptDraw PRO diagramming and vector drawing software extended with the Chemistry solution from the Science and Education area of ConceptDraw Solution Park.
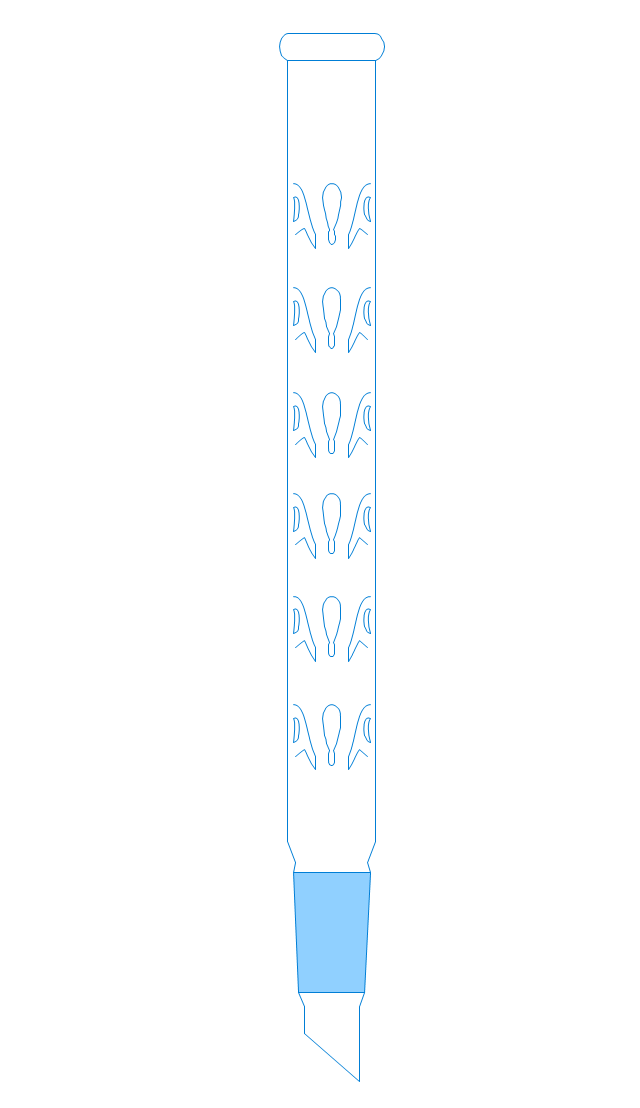
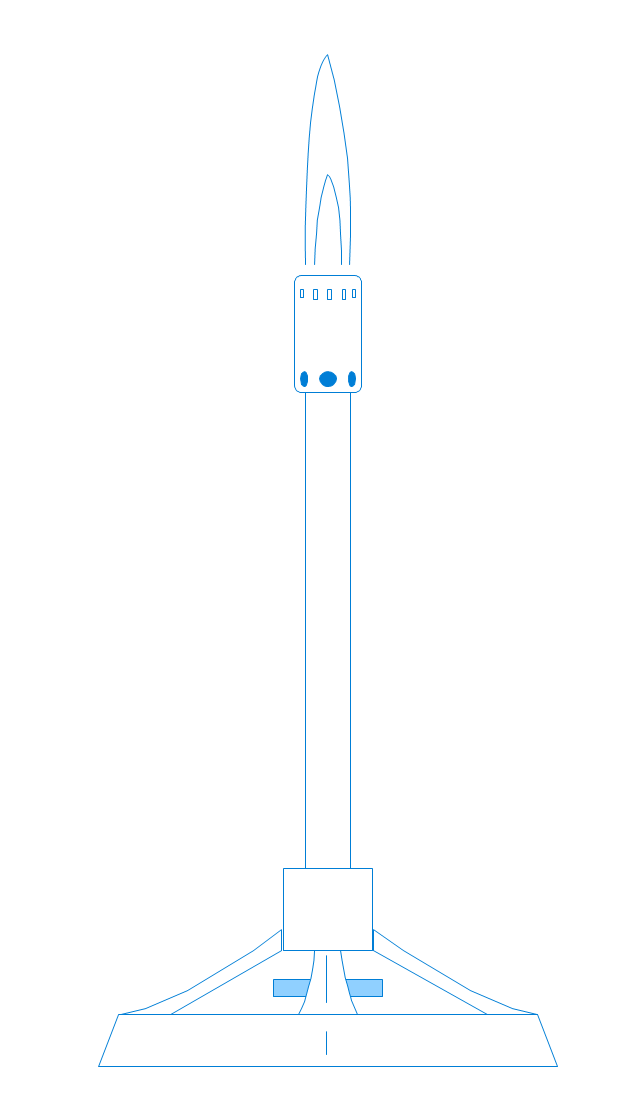
Vigreux distillation column
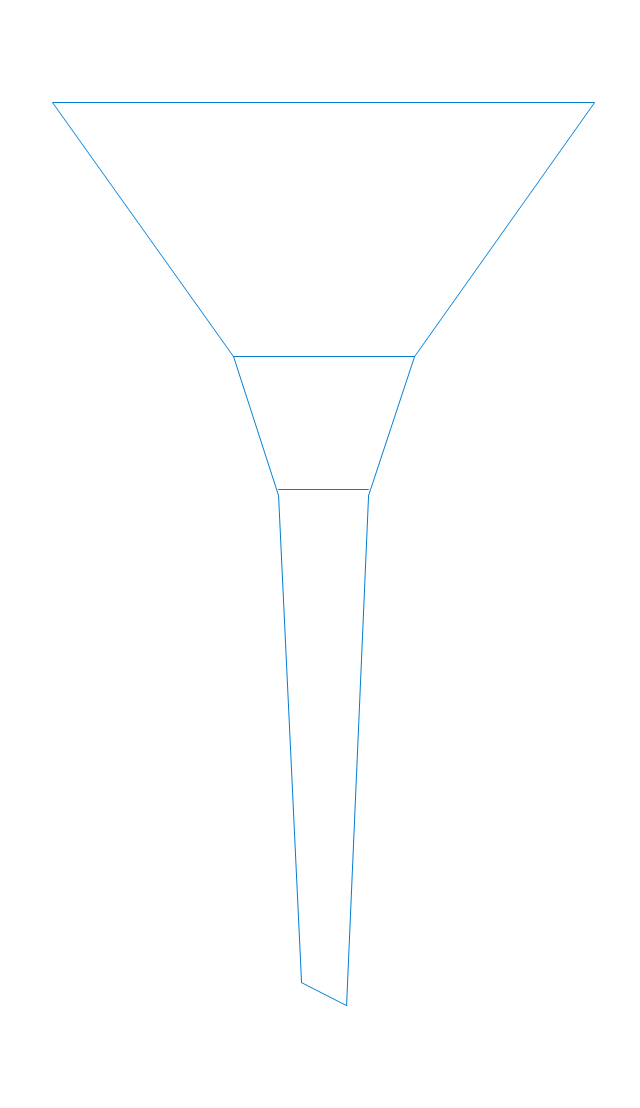
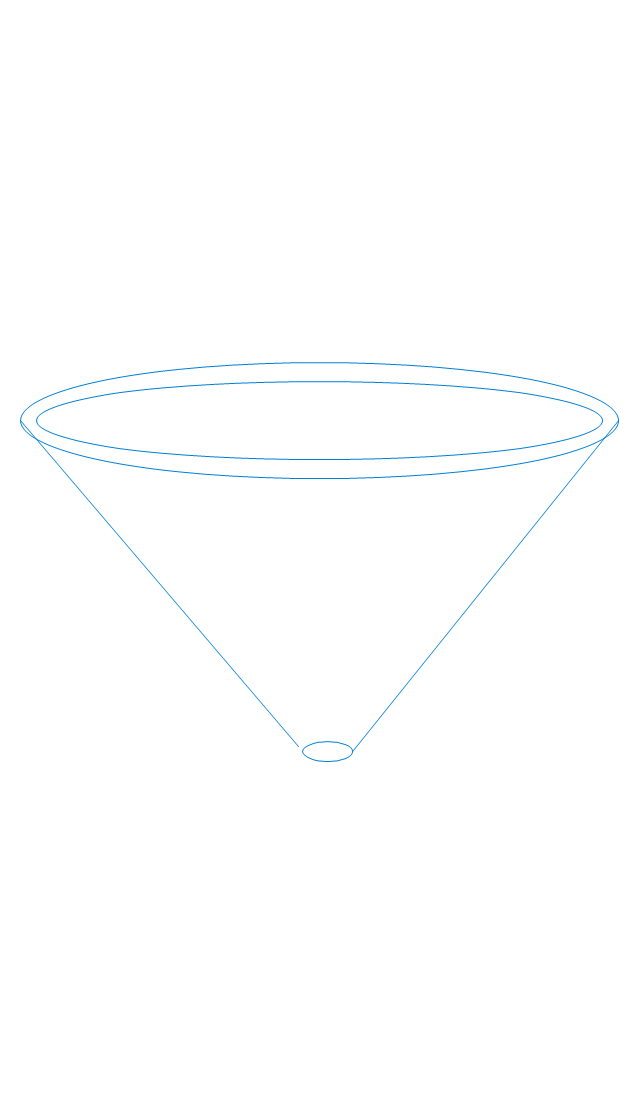
Hirsch funnel
Oil bath

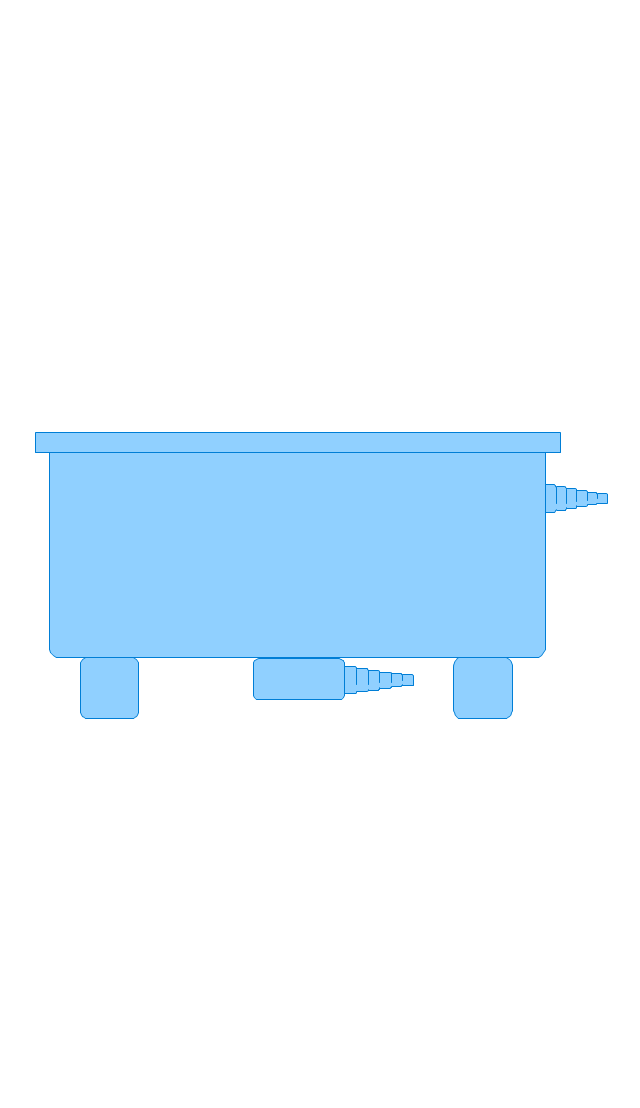
Steam bath
Thermometer

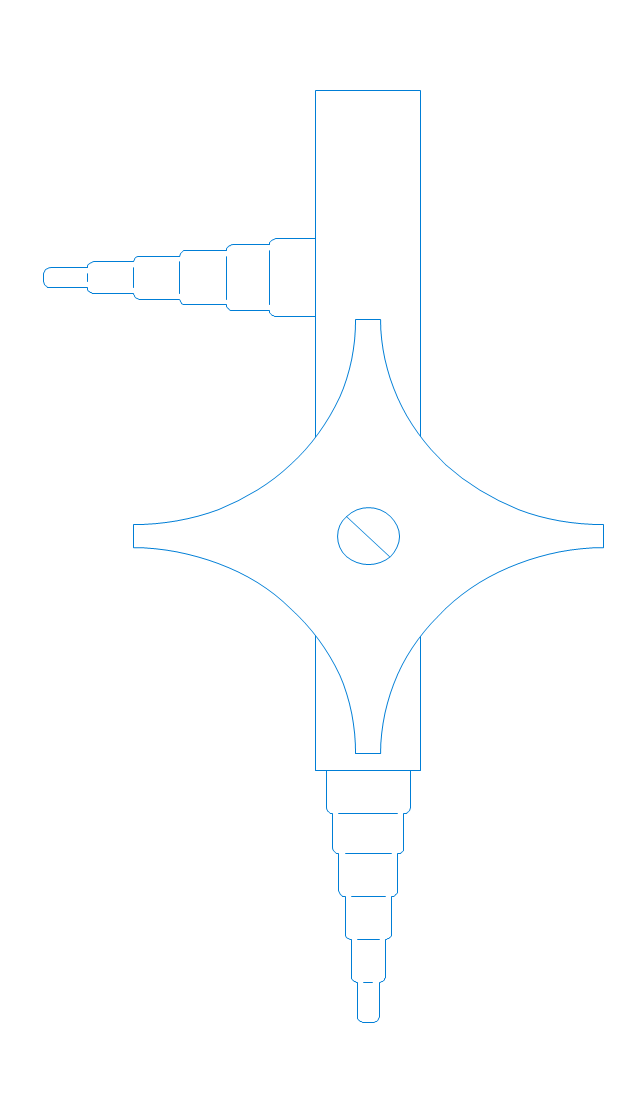
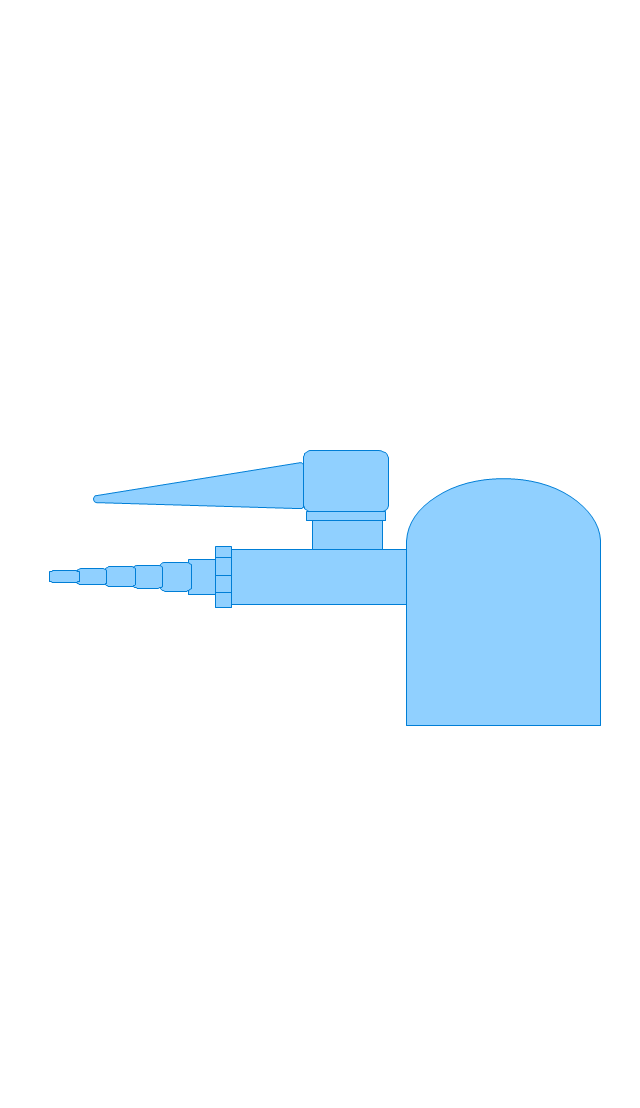
Tap (valve)
--laboratory-equipment---vector-stencils-library.png--diagram-flowchart-example.png)
Vacuum adaptor
Liebig condenser (long)
-laboratory-equipment---vector-stencils-library.png--diagram-flowchart-example.png)
Liebig condenser (short)
-laboratory-equipment---vector-stencils-library.png--diagram-flowchart-example.png)
Water faucet
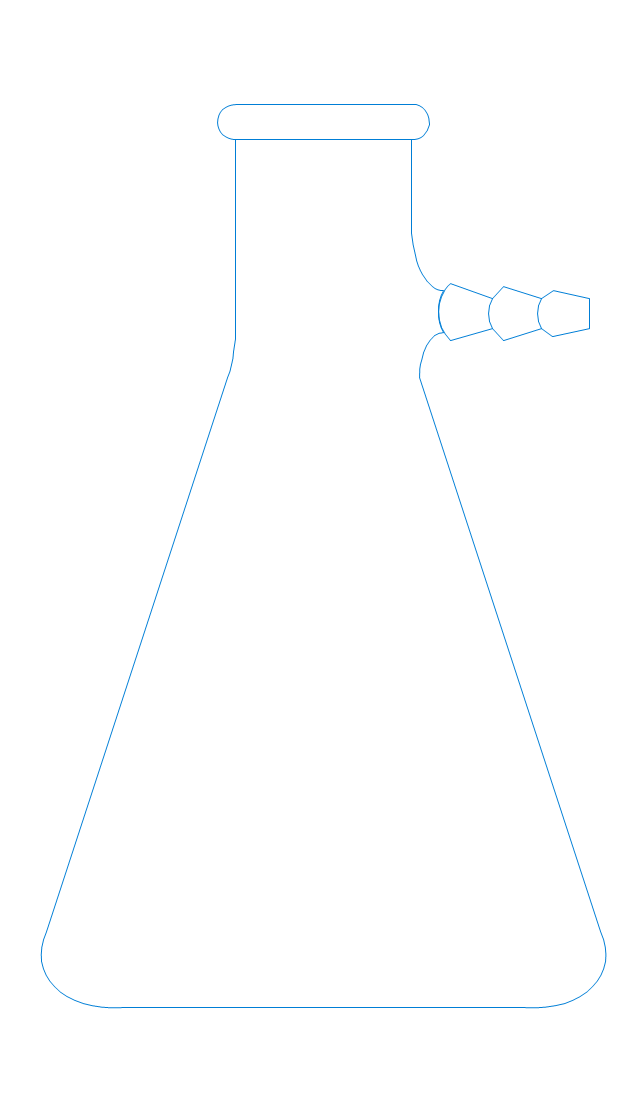
Büchner flask
Stemless funnel
Stemmed funnel

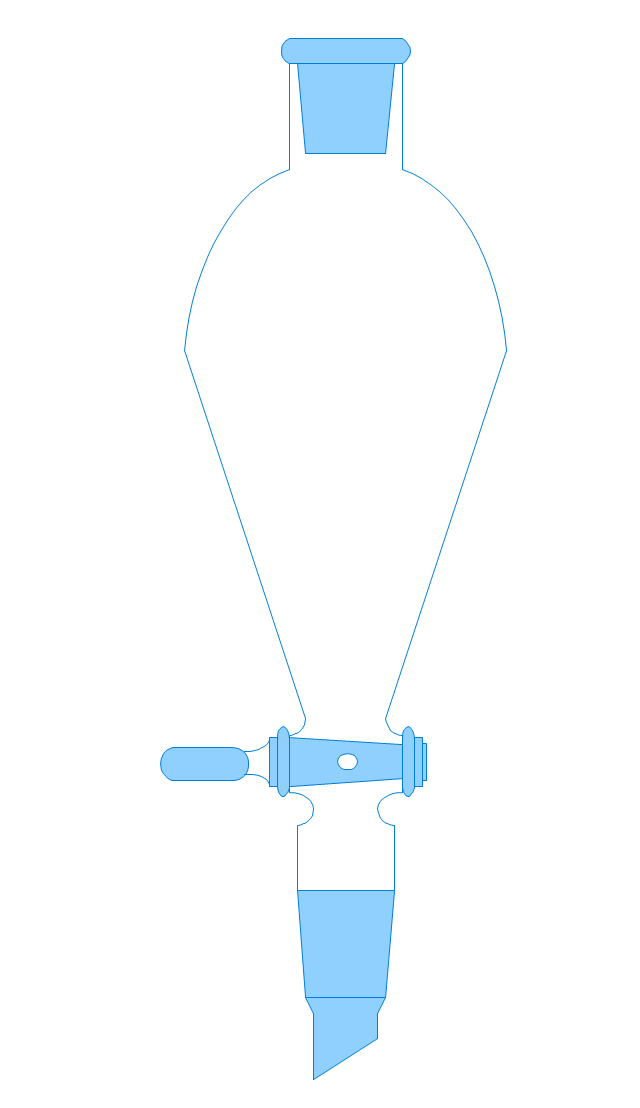
Separatory funnel
Heating mantle

Hot plate

Gas tap
Folded filter paper
Y-Adaptor
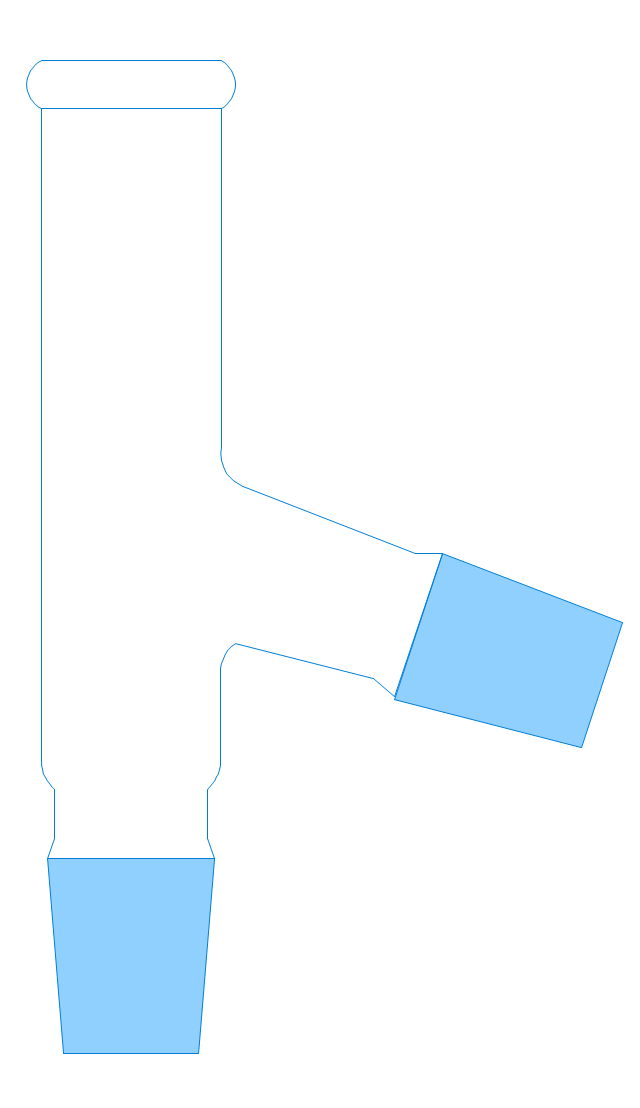
Claisen adapter

Bunsen burner
Büchner funnel

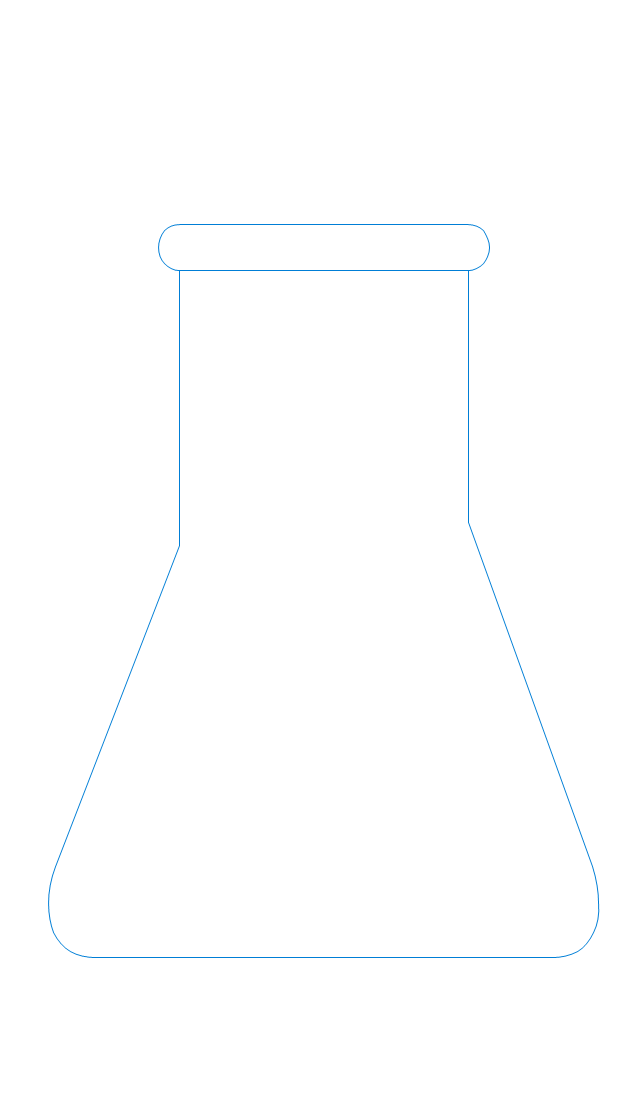
Erlenmeyer flask, 25ml
Round-bottom flask, 50ml

Round-bottom flask, 250ml

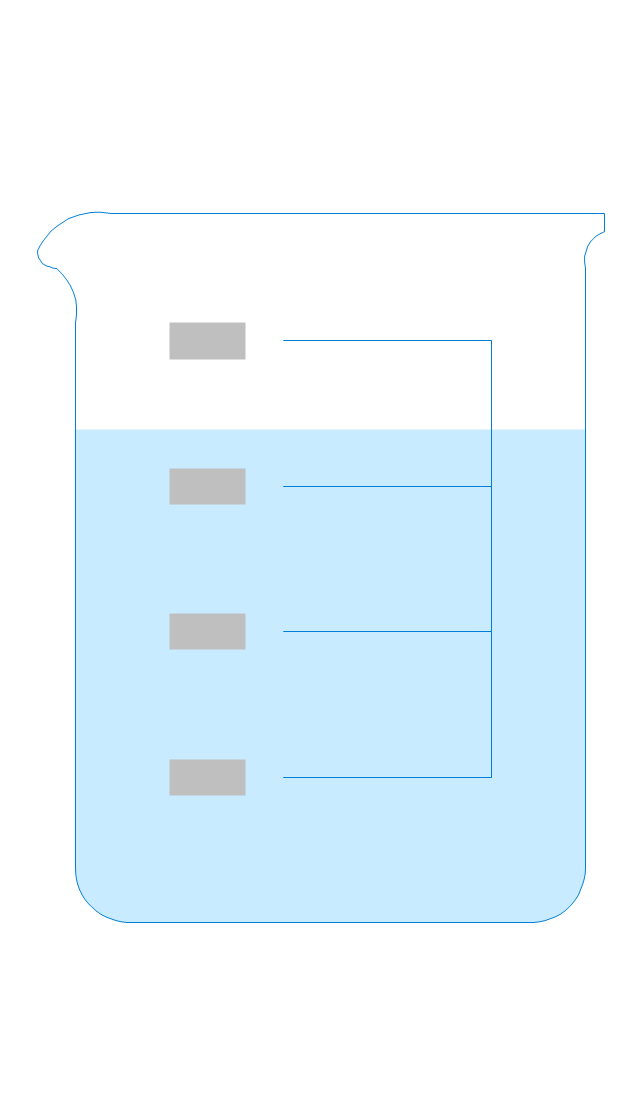
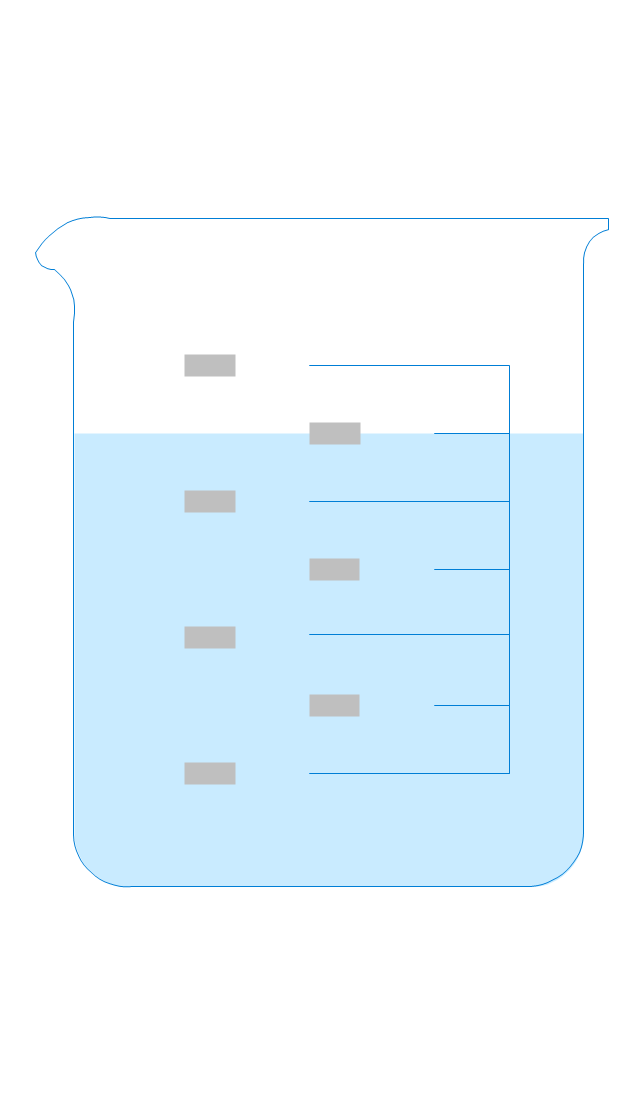
Beaker 100ml, filled
Beaker 100ml, empty

Beaker 500ml, filled
Beaker 500ml, empty

Erlenmeyer flask 250ml, filled
Erlenmeyer flask 250ml, empty
Business diagrams & Org Charts with ConceptDraw DIAGRAM


Chart Examples

- Design Of Nozzle In Process Equipment Design
- Design elements - Instruments | Design elements - Chemical ...
- Design elements - Chemical engineering | Chemical and Process ...
- Process Flow Diagram Symbols | Chemical and Process ...
- Laboratory equipment - Vector stencils library | Biology Symbols ...
- Chemical and Process Engineering | Design elements - Chemical ...
- Chemical engineering - Vector stencils library | Chemical and ...
- Process Engineering Shapes
- Chemical and Process Engineering | Design elements - Chemical ...
- Process Flow Diagram Symbols | Chemical Engineering | Chemical ...