 Entity-Relationship Diagram (ERD)
An Entity-Relationship Diagram (ERD) is a visual presentation of entities and relationships. That type of diagrams is often used in the semi-structured or unstructured data in databases and information systems. At first glance ERD is similar to a flowch
 IDEF0 Diagrams
IDEF0 Diagrams visualize system models using the Integration Definition for Function Modeling (IDEF) methodology. Use them for analysis, development and integration of information and software systems, and business process modelling.
Flowchart Software


 Fishbone Diagrams
The Fishbone Diagrams solution extends ConceptDraw DIAGRAM software with the ability to easily draw the Fishbone Diagrams (Ishikawa Diagrams) to clearly see the cause and effect analysis and also problem solving. The vector graphic diagrams produced using this solution can be used in whitepapers, presentations, datasheets, posters, and published technical material.
 Circular Arrows Diagrams
Circular Arrows Diagrams solution extends ConceptDraw DIAGRAM with extensive drawing tools, predesigned samples, Circular flow diagram template for quick start, and a library of ready circular arrow vector stencils for drawing Circular Arrow Diagrams, Segmented Cycle Diagrams, and Circular Flow Diagrams. The elements in this solution help managers, analysts, business advisers, marketing experts, scientists, lecturers, and other knowledge workers in their daily work.
 Scatter Diagrams
The Scatter Diagrams solution extends ConceptDraw DIAGRAM functionality with templates, samples, and a library of vector stencils that make construction of a Scatter Plot easy. The Scatter Chart Solution makes it easy to design attractive Scatter Diagrams used in various fields of science, work, and life activities. ConceptDraw DIAGRAM lets you enter the data to the table and construct the Scatter Plot Graph automatically according to these data.
 HVAC Plans
Use HVAC Plans solution to create professional, clear and vivid HVAC-systems design plans, which represent effectively your HVAC marketing plan ideas, develop plans for modern ventilation units, central air heaters, to display the refrigeration systems for automated buildings control, environmental control, and energy systems.
 Basic Divided Bar Diagrams
This solution extends the capabilities of ConceptDraw DIAGRAM with templates, samples and a library of vector stencils for drawing Divided Bar diagrams.
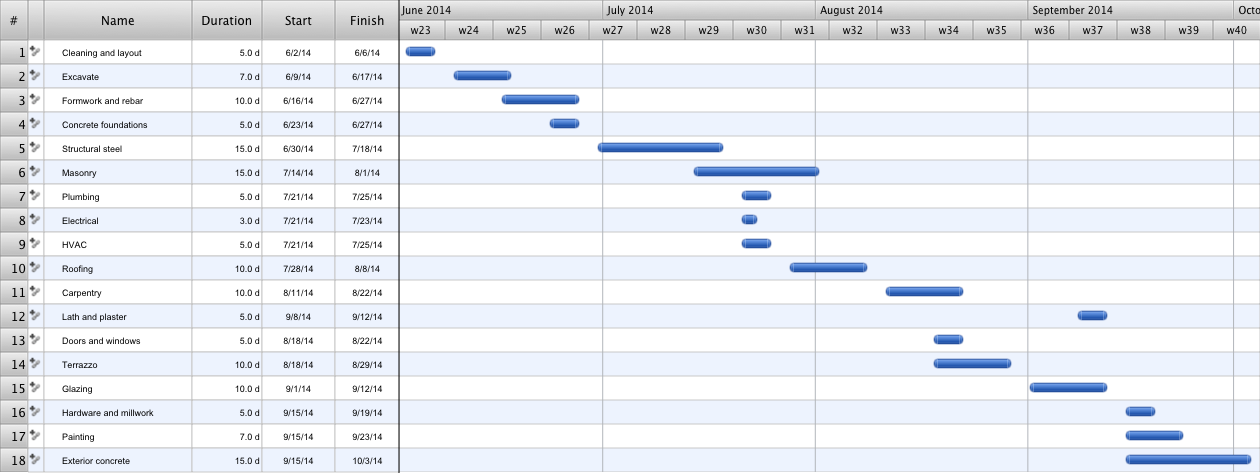
Construction Project Chart Examples
 Presentation Exchange
This solution extends ConceptDraw MINDMAP software with the ability to import presentations from Microsoft PowerPoint, as well as enhancing its existing presentation capabilities.
- Online Network Diagram Maker
- Telecommunication Network Diagrams | Network Diagram Software ...
- Visio Files and ConceptDraw | Network Diagram Software LAN ...
- Activity Network Diagram Method | PERT Chart Software | UML ...
- How to Draw a Computer Network Diagrams | Block Diagrams ...
- Network Diagram Software Logical Network Diagram
- Basic Network Diagram | Process Flowchart | Basic Flowchart ...
- Telecommunication Network Diagrams | Cross-Functional ...
- Business Processes | Telecommunication Network Diagrams | Cisco ...
- Types of Flowchart - Overview | Process Flowchart | Network ...
- Free Online Network Diagram Creator
- Draw Network Diagram based on Templates and Examples
- How to Add a Telecommunication Network Diagram to a PowerPoint ...
- CCTV Network Example | CCTV Network Diagram Software | Entity ...
- Process Flowchart | UML Diagram Types List | Network diagrams ...
- Network Diagramming Software for Design Cisco Network Diagrams ...
- Activity Network Diagram Method | Pie Chart Examples and ...
- Flowchart Definition | Computer Network Diagrams | Cross ...
- ConceptDraw PRO Network Diagram Tool | Entity Relationship ...
- Telecommunication Network Diagrams | Sales Process Flowchart ...